
MATLAB: An Introduction with Applications
6th Edition
ISBN: 9781119256830
Author: Amos Gilat
Publisher: John Wiley & Sons Inc
expand_more
expand_more
format_list_bulleted
Related questions
Question
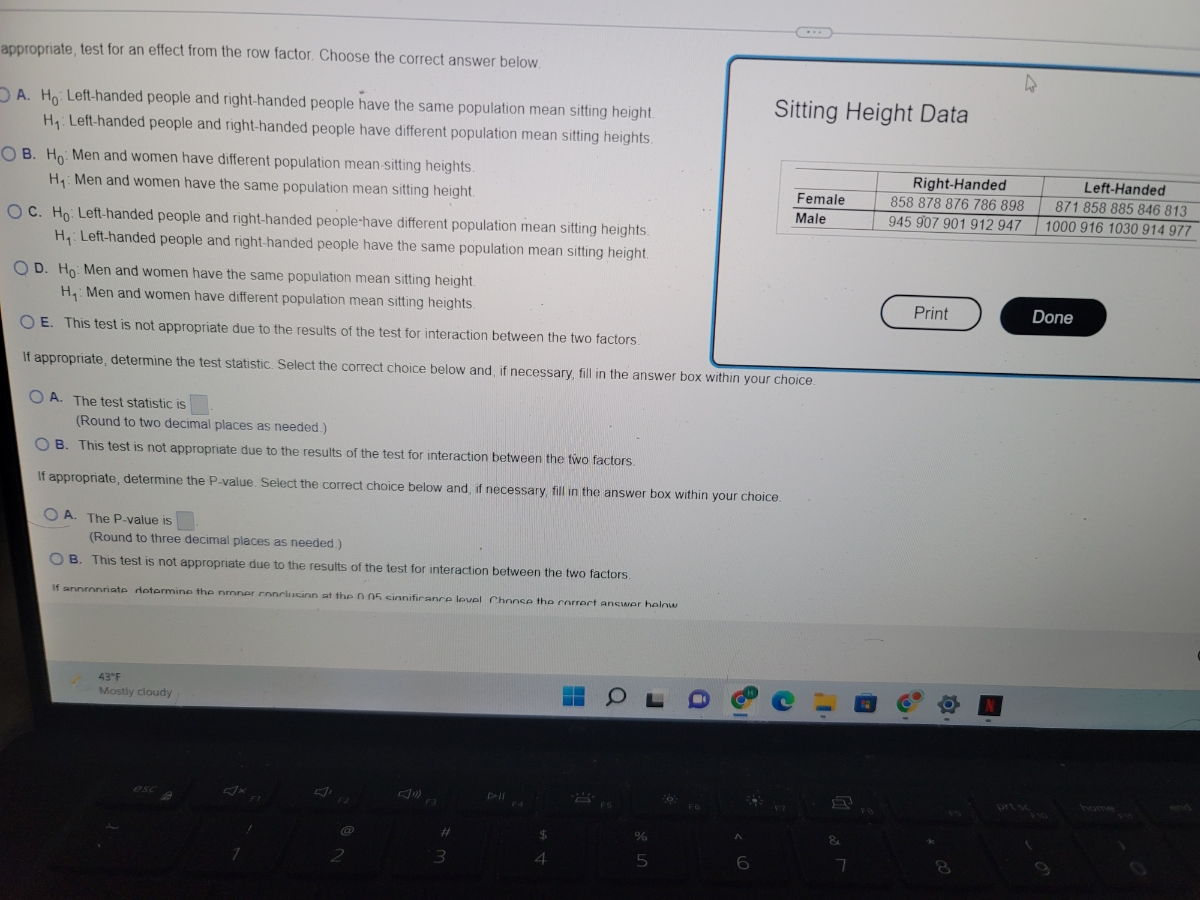

Transcribed Image Text:appropriate, test for an effect from the row factor. Choose the correct answer below.
Sitting Height Data
A. Ho: Left-handed people and right-handed people have the same population mean sitting height.
H₁: Left-handed people and right-handed people have different population mean sitting heights.
OB. Ho: Men and women have different population mean-sitting heights.
H₁: Men and women have the same population mean sitting height.
Female
Male
OC. Ho: Left-handed people and right-handed people have different population mean sitting heights.
H₁: Left-handed people and right-handed people have the same population mean sitting height.
OD. Ho: Men and women have the same population mean sitting height.
H₁: Men and women have different population mean sitting heights.
OE. This test is not appropriate due to the results of the test for interaction between the two factors.
If appropriate, determine the test statistic. Select the correct choice below and, if necessary, fill in the answer box within your choice.
OA. The test statistic is
(Round to two decimal places as needed.)
OB. This test is not appropriate due to the results of the test for interaction between the two factors.
If appropriate, determine the P-value. Select the correct choice below and, if necessary, fill in the answer box within your choice.
OA. The P-value is
(Round to three decimal places as needed.)
OB. This test is not appropriate due to the results of the test for interaction between the two factors.
If annronriate determine the nroner conclusion at the 005 significance level Choose the correct answer helow
43°F
▬▬
--
OL
Mostly cloudy
esc
%
5
2
1
#
3
F4
$
4
6
&
7
4
Right-Handed
858 878 876 786 898
945 907 901 912 947
Print
k
8
prt sc
Left-Handed
871 858 885 846 813
1000 916 1030 914 977
Done

Transcribed Image Text:The sitting height of a person is the vertical distance between the sitting surface and the top of the head. The accompanying
table lists sitting heights (mm) of randomly selected U.S. Army personnel collected as part of a large reputable study. Using
the data with a 0.05 significance level, what do you conclude?
Click the icon to view the sitting height data.
...
First test for an interaction between the two factors. Determine the null and alternative hypotheses. Choose the correct
answer below.
A. Ho Sitting heights are not affected by handedness.
H₁ Sitting heights are affected by handedness.
OB. Ho: Sitting heights are not affected by gender.
H₁ Sitting heights are affected by gender.
OC. Ho: Sitting heights are affected by an interaction between gender and handedness.
H₁ Sitting heights are not affected by an interaction between gender and handedness.
OD. Ho: Sitting heights are not affected by an interaction between gender and handedness.
H₁: Sitting heights are affected by an interaction between gender and handedness.
Determine the test statistic.
The test statistic is 2.14
(Round to two decimal places as needed.)
Determine the P-value.
A da
The P-value is 1629
acco
Use
of che
AN
Time Remaining: 00:51:35
S
Colu
Next
Expert Solution
This question has been solved!
Explore an expertly crafted, step-by-step solution for a thorough understanding of key concepts.

Step by stepSolved in 4 steps

Knowledge Booster

Similar questions
- Find the mean, median, and mode of the data, if possible. If any of these measures cannot be found or a measure does not represent the center of the data, explain why. The durations (in minutes) of power failures at a residence in the last 6 years are listed below. 84 22 35 112 112 51 84 12 54 69arrow_forwardShow work, thank you!arrow_forward5. See pictures to solvearrow_forward
- For this item, complete the choice matrix by clicking the appropriate answer in each row. The table shows the results from a random survey asking participants their age and current systolic blood pressure. Age (years) Systolic Blood 24 26 30 34 36 45 50 55 108 104 132 119 128 140 135 146 Pressure If a student correctly makes a scatter plot of the data from the survey, determine whether each statement is true or false. True False There are no outliers in the data. There is a positive association in the data. There is a nonlinear association in the data. A Calculator Chp esc % 3. W earrow_forwardSolve. 4) Construct a box plot from the data below. 20 25 26 26 26 272933 41 43 45 46 47 4850 50 50 51 53 55 57 60 61 62 63arrow_forwardMake a scatter diagram for the data. Use the scatter diagram to describe how, if at all, the variables are related. Subject A B C D EF G Time watching TV, x 8 4 2 7 756 Time on Internet, y 9 7 3 12 13 4 13 O A. The variables appear to be negatively, linearly related. 20- X 20 O B. The variables appear to be positively, linearly related. 20- X 20 N C. The variables do not appear to be linearly related. 20- 0 20 N D. The variables do not appear to be linearly related. 20- 0 X 20arrow_forward
- The table below shows the number of state-registered automatic weapons and the murder rate for several Northwestern states. 11.5 8.4 6.8 3.4 2.5 2.6 2.6 0.9 13.5 10.9 9.8 6.7 6.3 6.4 4.5 x = thousands of automatic weapons y = murders per 100,000 residents This data can be modeled by the equation 0.83x + 3.99. Use this equation to answer the following; Special Note: I suggest you verify this equation by performing linear regression on your calculator. A) How many murders per 100,000 residents can be expected in a state with 8.4 thousand automatic weapons? Answer Round to 3 decimal places. B) How many murders per 100,000 residents can be expected in a state with 7.3 thousand automatic weapons? Answer Round to 3 decimal places.arrow_forwardI keep getting these wrong on my homework please explainarrow_forwardQuestion Completion Status: Company A, Company B, and Company C sold a number of stocks each month in 2019. Each company described their stock sales in the box plots shown below. Which box plot is most left-skewed? Company A Company B Company C Save All Ar Click Save and Submit to save and submit. Click Save All Answers to save all answers. * Relative Worksheet Py....docx Reading - Mappi..pdf A W MLK Letter -2.pdf W Worksheet - W....docx 四田07A DIC. ostv 11arrow_forward
arrow_back_ios
arrow_forward_ios
Recommended textbooks for you
- MATLAB: An Introduction with ApplicationsStatisticsISBN:9781119256830Author:Amos GilatPublisher:John Wiley & Sons Inc
 Probability and Statistics for Engineering and th...StatisticsISBN:9781305251809Author:Jay L. DevorePublisher:Cengage Learning
 Statistics for The Behavioral Sciences (MindTap C...StatisticsISBN:9781305504912Author:Frederick J Gravetter, Larry B. WallnauPublisher:Cengage Learning
  Elementary Statistics: Picturing the World (7th E...StatisticsISBN:9780134683416Author:Ron Larson, Betsy FarberPublisher:PEARSON
 The Basic Practice of StatisticsStatisticsISBN:9781319042578Author:David S. Moore, William I. Notz, Michael A. FlignerPublisher:W. H. Freeman
 Introduction to the Practice of StatisticsStatisticsISBN:9781319013387Author:David S. Moore, George P. McCabe, Bruce A. CraigPublisher:W. H. Freeman
MATLAB: An Introduction with Applications
Statistics
ISBN:9781119256830
Author:Amos Gilat
Publisher:John Wiley & Sons Inc
Probability and Statistics for Engineering and th...
Statistics
ISBN:9781305251809
Author:Jay L. Devore
Publisher:Cengage Learning
Statistics for The Behavioral Sciences (MindTap C...
Statistics
ISBN:9781305504912
Author:Frederick J Gravetter, Larry B. Wallnau
Publisher:Cengage Learning
Elementary Statistics: Picturing the World (7th E...
Statistics
ISBN:9780134683416
Author:Ron Larson, Betsy Farber
Publisher:PEARSON
The Basic Practice of Statistics
Statistics
ISBN:9781319042578
Author:David S. Moore, William I. Notz, Michael A. Fligner
Publisher:W. H. Freeman
Introduction to the Practice of Statistics
Statistics
ISBN:9781319013387
Author:David S. Moore, George P. McCabe, Bruce A. Craig
Publisher:W. H. Freeman