ENGR.ECONOMIC ANALYSIS
14th Edition
ISBN: 9780190931919
Author: NEWNAN
Publisher: Oxford University Press
expand_more
expand_more
format_list_bulleted
Concept explainers
Question
#45

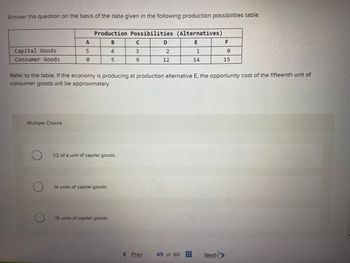
Transcribed Image Text:Answer the question on the basis of the data given in the following production possibilities table.
Capital Goods
Consumer Goods
A
5
0
Multiple Choice
Production Possibilities (Alternatives)
B
E
4
5
1/2 of a unit of capital goods.
14 units of capital goods.
15 units of capital goods.
с
3
9
D
Refer to the table. If the economy is producing at production alternative E, the opportunity cost of the fifteenth unit of
consumer goods will be approximately
< Prev
2
12
1
14
45 of 60 ⠀⠀⠀
F
Next
0
15

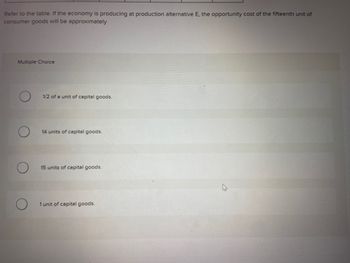
Transcribed Image Text:Refer to the table. If the economy is producing at production alternative E, the opportunity cost of the fifteenth unit of
consumer goods will be approximately
Multiple Choice
O
1/2 of a unit of capital goods.
14 units of capital goods.
15 units of capital goods.
1 unit of capital goods.
Expert Solution
This question has been solved!
Explore an expertly crafted, step-by-step solution for a thorough understanding of key concepts.
This is a popular solution
Trending nowThis is a popular solution!
Step by stepSolved in 3 steps

Knowledge Booster
Learn more about
Need a deep-dive on the concept behind this application? Look no further. Learn more about this topic, economics and related others by exploring similar questions and additional content below.Similar questions
- Note: the answer should be typed. And Answer with 100% accuracy.arrow_forwardplease see the attached1arrow_forwardQuestion 4 (Elasticity)" 200 180 160 140 120 100 80 60 40 Demand 20 20 40 60 80 100 120 140 160 Quantity Demanded (per period) Figure 20.1 According to Figure above. If the price is reduced from $100 to $80 in Figure above. Calculate a. Percentage change in quantity demanded b. Percentage change in price Price elasticity of demand? What is this type of price elasticity of demand? C. d. What is an impact toward total revenue? Explain and show your calculation Price (per unit)arrow_forward
- 1) https://www.youtube.com/watch?v=u5P8AZRBLac 2) https://www.youtube.com/watch?v=9MpVjxxpExM please I need a short summary of these videosarrow_forwardIn the United States, 2018 was a bad year for growing wheat. And as wheat supply decreased, the price of wheat rose dramatically, leading to a lower quantity demanded (a movement along the demand curve). The accompanying table describes what happened to prices and the quantity of wheat demanded. 2017 2018 Quantity demanded (bushels) 2.3 billion 1.7 billion Average price (per bushel) $4.02 $4.98 Using the midpoint method, calculate the price elasticity of demand for winter wheat. What is the total revenue for U.S. wheat farmers in 2017 and 2018? Did the bad harvest increase or decrease the total revenue of U.S. wheat farmers? How could you have predicted this from your answer to part a?arrow_forwardGeorge Kyparisis owns a company that manufactures sailboats. Actual demand for George's sailboats during each of the past four seasons was as follows: Year D Season Winter Spring Summer Fall 1 1,440 1,500 1,040 680 2 1,280 1,440 2,120 810 3 1,080 1,600 2,040 670 4 960 1,580 1,900 500 George has forecasted that annual demand for his sailboats in year 5 will equal 6,500 sailboats. Based on the given data and using the seasonal model, the demand level for George's sailboats in the spring of year 5 will be 1937 sailboats (enter your final answer as a whole number and round all intermediate calculations to two decimal places).arrow_forward
- Filll in the values in the equation to calculate the PED for the Malabar coffee Price Elasticity of Demand (PED)= abs( % / % )=arrow_forward19. Canadians' New Focus on Thrift Canadian shoppers' shift to greater thriftiness has been unkind to retailers like Bikini Village and Le Chateau, which recently posted losses, but it may be a boon for budget stores like Dollarama Inc., which recently generated double-digit sales. Source: The Financial Post, July 3, 2011 Draw a graph to show the effect of increased thriftiness on sales at (i) Bikini Village and (ii0 Dollarama. Use the following information to work Problems 20 and 21. Boom Time For "Gently Used" Clothes Most retailers are blaming the economy for their poor sales, but one store chain that sells used name-brand children's clothes, toys, and furniture is boldly declaring that an economic downturn can actually be a boon for its business. Last year, the company took in $20 million in sales, up 5% from the previous year. Sales are already up 5% this year. Sources: CNN, April 17, 2008 20. a. According to news clip, is used clothing a…arrow_forwardUse the following demand function to answer questions 3-4. Show all your work to receive full credit. Qpork= 5.2 – 1.47Ppork + 1.82Peef + 0.18Pchicken + 0.38/ Calculate the cross-price elasticity of pork demand with respect to beef if the price of pork is $3.78/lb., the price of beef is $6.15/1b., the price of chicken is $1.90/lb., disposable income is $48000 per capita, and the total quantity demanded of pork is 52 lbs. per capita. If the price of beef increases by 12%, how much would you expect the quantity demanded of pork to change (in lbs.)?arrow_forward
arrow_back_ios
SEE MORE QUESTIONS
arrow_forward_ios
Recommended textbooks for you

 Principles of Economics (12th Edition)EconomicsISBN:9780134078779Author:Karl E. Case, Ray C. Fair, Sharon E. OsterPublisher:PEARSON
 Engineering Economy (17th Edition)EconomicsISBN:9780134870069Author:William G. Sullivan, Elin M. Wicks, C. Patrick KoellingPublisher:PEARSON
 Principles of Economics (MindTap Course List)EconomicsISBN:9781305585126Author:N. Gregory MankiwPublisher:Cengage Learning
 Managerial Economics: A Problem Solving ApproachEconomicsISBN:9781337106665Author:Luke M. Froeb, Brian T. McCann, Michael R. Ward, Mike ShorPublisher:Cengage Learning
 Managerial Economics & Business Strategy (Mcgraw-...EconomicsISBN:9781259290619Author:Michael Baye, Jeff PrincePublisher:McGraw-Hill Education


Principles of Economics (12th Edition)
Economics
ISBN:9780134078779
Author:Karl E. Case, Ray C. Fair, Sharon E. Oster
Publisher:PEARSON

Engineering Economy (17th Edition)
Economics
ISBN:9780134870069
Author:William G. Sullivan, Elin M. Wicks, C. Patrick Koelling
Publisher:PEARSON

Principles of Economics (MindTap Course List)
Economics
ISBN:9781305585126
Author:N. Gregory Mankiw
Publisher:Cengage Learning

Managerial Economics: A Problem Solving Approach
Economics
ISBN:9781337106665
Author:Luke M. Froeb, Brian T. McCann, Michael R. Ward, Mike Shor
Publisher:Cengage Learning

Managerial Economics & Business Strategy (Mcgraw-...
Economics
ISBN:9781259290619
Author:Michael Baye, Jeff Prince
Publisher:McGraw-Hill Education