
Related questions
Bank X and Bank Y are two of the top 5 banks operating in Zambia. As of 31 December 2023,
Bank X held 14% of the total assets and deposits in the Zambian banking sector, while Bank Y
held 16%, respectively. The two banks have a comparable number of branches and ATMs spread
out over the country and are typical commercial banks engaged in both retail and wholesale
business.
REQUIRED:
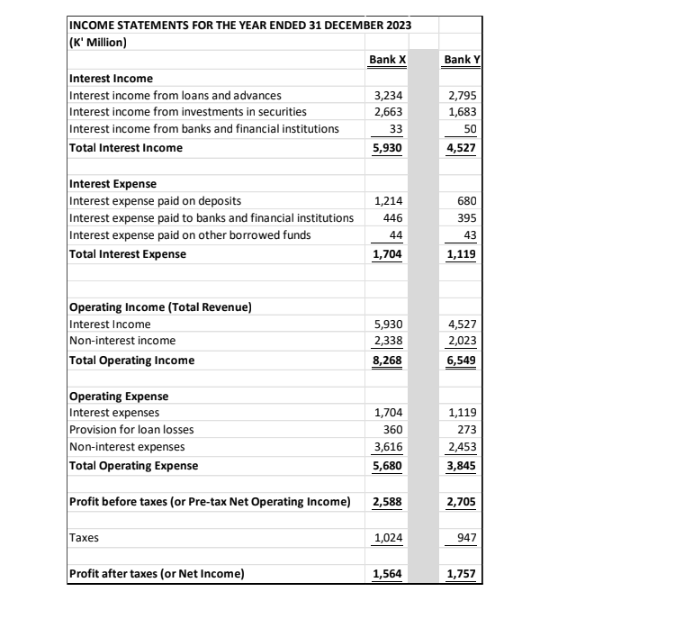
To answer the questions, refer to the summary financial statements of Bank X and Bank Y in
Annex 1 (and the associated Excel worksheets).
For all
analysis (e.g., average assets for (2023) = [Total assets (2023) + Total assets (2022)]
divided by 2).
▪ You must present all the numerical answers to two decimal places.
1.
A. Calculate the ROA ratios for Bank X and Bank Y and what can you conclude from the
results obtained.
B. By decomposing the ratio into its major components, clearly show the sources of the
difference in the two banks’ ROA ratios. Please summarise the results in a table format.
C. What is(are) the major contributor(s) for the difference in the performance of the two banks
as revealed by the results in (B) above?
2.
A. Calculate the ROE ratios for Bank X and Bank Y and what can you conclude from the
results obtained.
B. Clearly demonstrate how the Equity Multiplier (EM) and Return on Assets (ROA) are
related to Return on Equity (ROE). Please summarise the results in a table format.
C. What is(are) the major contributor(s) for the difference in the performance of the two banks
as revealed by the results in (B) above?
3. Net Interest Margin (NIM)
A. Calculate the NIM ratios for Bank X and Bank Y and what can you conclude from the
results obtained.
B. By decomposing the ratio into its major components, clearly show the sources of the
difference in the two banks’ NIM ratios. Please summarise the results in a table format.
D. What is(are) the major contributor(s) for the difference in the performance of the two banks
as revealed by the results in (B) above?
4. Burden ratio
A. Calculate the burden ratios for Bank X and Bank Y and what can you conclude from the
results obtained.
B. By decomposing the ratio into its major components, clearly show the sources of the
difference in the two banks’ burden ratios. Please summarise the results in a table format.
C. What is(are) the major contributor(s) for the difference in the performance of the two banks
as revealed by the results in (B) above?


Step by stepSolved in 1 steps


- You Answered Correct Answer A bank has $223 million in assets in the 0 percent risk-weight category. It has $363 million in assets in the 20 percent risk- weight category. It has $153 million in assets in the 50 percent risk-weight category and has $303 million in assets in the 100 percent risk-weight category. This bank has $13 million in Tier 1 capital and $17 million in Tier 2 capital. Is this Bank meeting Basel I requirement of 4% Tier 1 capital to risk-weighted assets (RWA)? No: Type 0 Yes: Type 1 If you type 0, Canvas may indicate the question is left unanswered. Disregard this message. Canvas will grade this question correctly. If the tier-1 capital to RWA is exactly 4%, type 0. 1 O margin of error +/- 2%arrow_forwardCintas Corporation designs, manufactures, and implements corporate Identity uniform programs that it rents or sells to customers throughout the United States and Canada. The company's stock is traded on the NASDAQ and has provided Investors with significant ROES over the past few years. Selected Information from the company's financial statements follows. Select Statement of Earnings Information Net revenue Cost of sales Selling, general, and administrative expenses Interest expense, net Income tax expense Net earnings Select Statement of Cash Flows Information Cash paid for interest Cash flows from operating activities Select Statement of Financial Position Information Cash and cash equivalents Accounts receivable, net Inventories, net CINTAS CORPORATION (in millions) Uniforms and other rental items in service Income taxes receivable, current Prepaid expenses and other current assets Accounts payable Accrued compensation and related liabilities Accrued liabilities Operating lease…arrow_forwardCould someone answer both of the question as they are connected?arrow_forward
- Essentials Of InvestmentsFinanceISBN:9781260013924Author:Bodie, Zvi, Kane, Alex, MARCUS, Alan J.Publisher:Mcgraw-hill Education,


 Foundations Of FinanceFinanceISBN:9780134897264Author:KEOWN, Arthur J., Martin, John D., PETTY, J. WilliamPublisher:Pearson,
 Fundamentals of Financial Management (MindTap Cou...FinanceISBN:9781337395250Author:Eugene F. Brigham, Joel F. HoustonPublisher:Cengage Learning
 Corporate Finance (The Mcgraw-hill/Irwin Series i...FinanceISBN:9780077861759Author:Stephen A. Ross Franco Modigliani Professor of Financial Economics Professor, Randolph W Westerfield Robert R. Dockson Deans Chair in Bus. Admin., Jeffrey Jaffe, Bradford D Jordan ProfessorPublisher:McGraw-Hill Education