
ENGR.ECONOMIC ANALYSIS
14th Edition
ISBN: 9780190931919
Author: NEWNAN
Publisher: Oxford University Press
expand_more
expand_more
format_list_bulleted
Related questions
Question
thumb_up100%
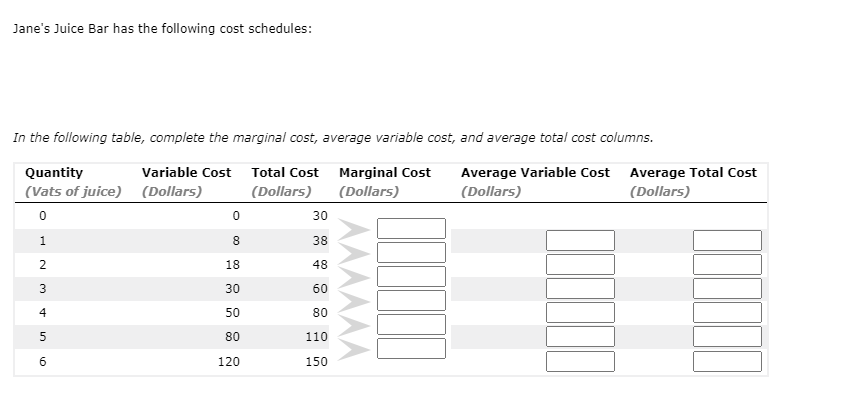

Transcribed Image Text:Jane's Juice Bar has the following cost schedules:
In the following table, complete the marginal cost, average variable cost, and average total cost columns.
Quantity
Variable Cost Total Cost Marginal Cost
Average Variable Cost Average Total Cost
(Vats of juice) (Dollars)
(Dollars)
(Dollars)
(Dollars)
(Dollars)
30
1
38
18
48
30
60
4
50
80
5
80
110
120
150

Transcribed Image Text:On the following graph, use the orange points (square symbol) to plot the marginal-cost curve for Jane's Juice Bar. (Note: Be sure to plot from left to
right and to plot between integers. For example, if the marginal cost of increasing production from 1 vat of juice to 2 vats of juice is $5, then you
would plot a point at (1.5, 5).) Then use the purple points (diamond symbol) to plot the average-variable cost curve starting at 1 vat of juice, and use
the green points (triangle symbol) to plot the average-total-cost curve also starting at 1 vat of juice.
40
35
Marginal Cost
30
25
Average Variable Cost
20
Average Total Cost
15
10
5
3
4
5
Quantity (Vats of juice)
Which of the following statements are true according to the previous graph? Check all that apply.
O The marginal-cost curve is below the average-total-cost curve when output is greater than four and average total cost is rising.
O The marginal-cost curve lies below the average-variable-cost curve.
O The marginal-cost curve is above the average-total-cost curve when output is greater than four and average total cost is rising.
Costs
Expert Solution
This question has been solved!
Explore an expertly crafted, step-by-step solution for a thorough understanding of key concepts.

This is a popular solution

Trending nowThis is a popular solution!

Step by stepSolved in 6 steps with 1 images

Knowledge Booster


Learn more about
Need a deep-dive on the concept behind this application? Look no further. Learn more about this topic, economics and related others by exploring similar questions and additional content below.Similar questions
- Kontrol paneli Site ana sayfası Takvim Nişanlar Tüm dersler Soru 9 Total cost is calculated as Henüz cevaplanmadı Lütfen birini seçin: 4 üzerinden O A. the sum of average fixed cost and average variable cost. işaretlenmiş O B. the sum of total fixed cost and total variable cot. P Soruyu işaretle O C. the sum of marginal cost and average cost. O D. the product of average total cost and price. OE the sum of all the firm's explicit costs. ÖNCEKİ SAYFAarrow_forwardWhat is the summary of the video "See the true cost of your cheap chicken"arrow_forwardMacmillan Learning a. In the accompanying diagram, place the points labeled Minimum AVC and Minimum ATC in their correct places. Marginal cost, average cost ($ per unit) True False Minimum AVC Minimum ATC F MC Quantity b. Average variable cost reaches its minimum point at a lower level of output than average total cost.arrow_forward
- 6 5 nts eBook Print References Mc Graw Hill Output 0 1 2 3 4 5 6 7 8 9 $ Total Cost $2,500 3,410 4,040 4,480 4,900 5,220 5,540 6,310 7,320 9,710 units variabl Cost $ 0 b. What is the value of total fixed cost? units 910 1540 1980 2400 2720 3040 3810 4820 7210 Marginal Cost 1 c. What is the most productive level of output? $ 910 630 440 420 320 320 770 1010 2390 d. At what output is economic capacity? Output: e. If TFC doubled, what is the marginal cost of the 7th unit? Marginal cost: $ Average Total Cost 1 $ 3410 2020 1493.33 H a 1225 1044 923.33 901.42 915 1078.89 a Average Variable Cost D $ 1 625 500 416.67 35713 312.5 27778arrow_forward.......arrow_forwardTotal Cost Marginal Cost (Dollars) Average Variable Cost (Dollars per pair) Fixed Cost Variable Cost Average Total Cost (Dollars per pair) Quantity (Pairs) (Dollars) (Dollars) (Dollars) 120 80 1 200 40 2 240 45 3 285 55 4 340 85 425 115 6 540 On the following graph, plot Douglas Fur's average total cost (ATC) curve using the green points (triangle symbol). Next, plot its average variable cost (AVC) curve using the purple points (diamond symbol). Finally, plot its marginal cost (MC) curve using the orange points (square symbol). (Hint: For ATC and AVC, plot the points on the integer; for example, the ATC of producing one pair of boots is $200, so you should start your ATC curve by placing a green point at (1, 200). For MC, plot the points between the integers: For example, the MC of increasing production from zero to one pair of boots is $80, so you should start your MC curve by placing an orange square at (0.5, 80).) Note: Plot your points in the order in which you would like them…arrow_forward
- mework 6 i 1 Saved nics Game Obituary Project Help Save & Exit Submit a. Complete the following cost schedule by computing marginal cost, average fixed cost, average variable cost, and average total cost. Instructions: Round your responses to the nearest whole number. Rate of nts Total Cost Output Marginal Cost Average Average Average Fixed Cost Variable Cost Total Cost 0 $600 Print 1 800 2 1,050 3 1,400 4 5 1,800 2,300 Mc Graw Hill b. Use the cost data to plot the average total cost (ATC) and marginal cost (MC) curves on a graph. Instructions: Use the tools provided 'ATC' and 'MC' to draw each curve point by point (plot 5 points total for each curve). Round your points for ATC up to the nearest $25. Q Search Prev 1 of 4 Next > 3/arrow_forwardQuestion attachedarrow_forwardThe table below shows cost data for producing different amounts of cleaning products. Use the given information to find the Average Variable Cost. Quantity Total Cost Average Variable Cost 11 1 2 فيا 4 5 28 46 60 65 68 4. 4. 1.arrow_forward
- S Costs 35 3:0 25 20 15 10 0 2 3 Quantity (Vats of juice) E Marginal Cost O Search Average Variable Cost Average Total Cost Which of the following statements are true according to the previous graph? Check all that apply. The marginal-cost curve is above the average-total-cost curve when output is greater than four and average total cost is rising. The marginal-cost curve is below the average-total-cost curve when output is greater than four and average total cost is rising. The marginal-cost curve lies below the average-variable-cost curve. C (((.arrow_forward15 3. Jane's Juice Bar has the following cost schedules: Quantity 0 vats of juice $0 1 10 12 25 3 45 4 70 100 135 10 1 12 13 14 15 Variable cost Total cost $30 40 55 75 100 130 165 Calculate average variable cost, average total cost, and marginal cost for each quantity. Put these numbers in the table below. Quantity Average variable cost Average total cost Marginal cost a. b. Graph all three curves (average variable cost, average total cost and marginal cost) using Excel or a piece of grid paper. Attach the graph to this assignment. What is the relationship between the marginal-cost curve and the average total cost curve? Between the marginal cost curve and the average variable cost curve? Explainarrow_forward. Various measures of cost Douglas Fur is a small manufacturer of fake-fur boots in Chicago. The following table shows the company’s total cost of production at various production quantities. Fill in the remaining cells of the following table. Quantity Total Cost Marginal Cost Fixed Cost Variable Cost Average Variable Cost Average Total Cost (Pairs) (Dollars) (Dollars) (Dollars) (Dollars) (Dollars per pair) (Dollars per pair) 0 120 — — 1 200 2 240 3 285 4 340 5 425 6 540 On the following graph, plot Douglas Fur’s average total cost (ATC) curve using the green points (triangle symbol). Next, plot its average variable cost (AVC) curve using the purple points (diamond symbol). Finally, plot its marginal cost (MC) curve using the orange points (square symbol). (Hint: For ATC and…arrow_forward
arrow_back_ios
SEE MORE QUESTIONS
arrow_forward_ios
Recommended textbooks for you
 Principles of Economics (12th Edition)EconomicsISBN:9780134078779Author:Karl E. Case, Ray C. Fair, Sharon E. OsterPublisher:PEARSON
 Engineering Economy (17th Edition)EconomicsISBN:9780134870069Author:William G. Sullivan, Elin M. Wicks, C. Patrick KoellingPublisher:PEARSON
 Principles of Economics (MindTap Course List)EconomicsISBN:9781305585126Author:N. Gregory MankiwPublisher:Cengage Learning
 Managerial Economics: A Problem Solving ApproachEconomicsISBN:9781337106665Author:Luke M. Froeb, Brian T. McCann, Michael R. Ward, Mike ShorPublisher:Cengage Learning
 Managerial Economics & Business Strategy (Mcgraw-...EconomicsISBN:9781259290619Author:Michael Baye, Jeff PrincePublisher:McGraw-Hill Education
Principles of Economics (12th Edition)
Economics
ISBN:9780134078779
Author:Karl E. Case, Ray C. Fair, Sharon E. Oster
Publisher:PEARSON
Engineering Economy (17th Edition)
Economics
ISBN:9780134870069
Author:William G. Sullivan, Elin M. Wicks, C. Patrick Koelling
Publisher:PEARSON
Principles of Economics (MindTap Course List)
Economics
ISBN:9781305585126
Author:N. Gregory Mankiw
Publisher:Cengage Learning
Managerial Economics: A Problem Solving Approach
Economics
ISBN:9781337106665
Author:Luke M. Froeb, Brian T. McCann, Michael R. Ward, Mike Shor
Publisher:Cengage Learning
Managerial Economics & Business Strategy (Mcgraw-...
Economics
ISBN:9781259290619
Author:Michael Baye, Jeff Prince
Publisher:McGraw-Hill Education