
Glencoe Algebra 1, Student Edition, 9780079039897, 0079039898, 2018
18th Edition
ISBN: 9780079039897
Author: Carter
Publisher: McGraw Hill
expand_more
expand_more
format_list_bulleted
Related questions
Question
thumb_up100%
Hi, I'm hoping all is well. I'm late in my Statistics I assignments... way behind and also I'm scared and terrified of Mathematics. I have attached pdfs with questions highlighted and circled. I have 7 more attachments, what is your recommendation-to keep sending them 2 at a time? Thank for your help and have a great day! Joseph.
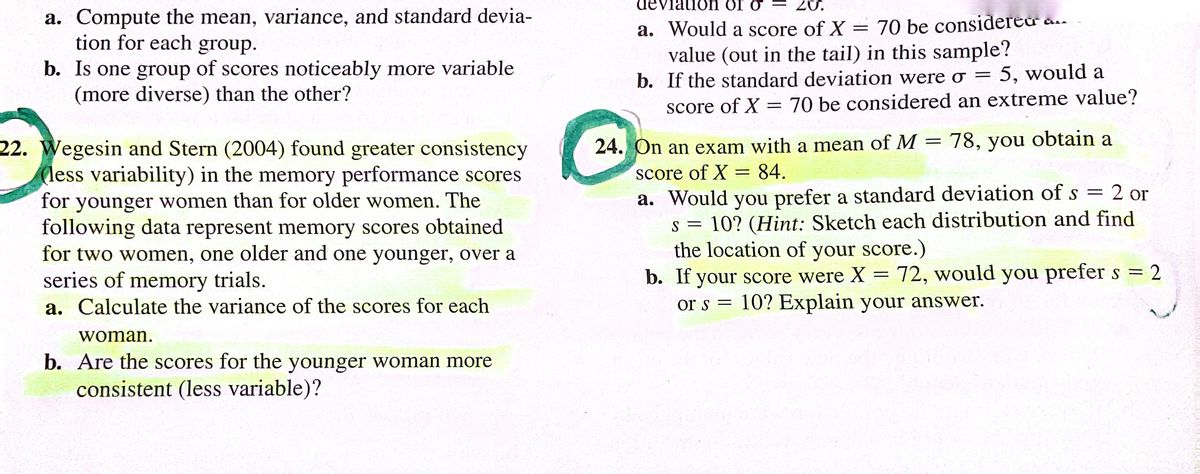

Transcribed Image Text:a. Compute the mean, variance, and standard devia-
tion for each group.
b. Is one group of scores noticeably more variable
(more diverse) than the other?
22. Wegesin and Stern (2004) found greater consistency
(less variability) in the memory performance scores
for younger women than for older women. The
following data represent memory scores obtained
for two women, one older and one younger, over a
series of memory trials.
a. Calculate the variance of the scores for each
woman.
b. Are the scores for the younger woman more
consistent (less variable)?
20.
deviation or o
a. Would a score of X
70 be considered
value (out in the tail) in this sample?
b. If the standard deviation were o = 5, would a
score of X = 70 be considered an extreme value?
=
24. On an exam with a mean of M 78, you obtain a
score of X = 84.
a. Would you prefer a standard deviation of s
=
2 or
S =
10? (Hint: Sketch each distribution and find
the location of your score.)
b. If your score were X = 72, would you prefer s = 2
10? Explain your answer.
or s =
-

Transcribed Image Text:and standard deviation?
10.
10. Why is the formula for sample variance different from
the formula for population variance?
11. For the following sample of n = 6 scores: 0, 11, 5,
10, 5,5
a. Sketch a histogram showing the sample
distribution.
your
b. Locate the value of the sample mean in
sketch, and make an estimate of the standard
deviation (as done in Example 4.6).
c. Compute SS, variance, and standard deviation for
the sample. (How well does your estimate compare
with the actual value of s?)
=
12. Calculate SS, variance, and standard deviation for the
following sample of n 8 scores: 0, 4, 1, 3, 2. 1, 1, 0.
13. Calculate SS, variance, and standard deviation for the
following sample of n = 5 scores: 2, 9, 5, 5, 9.
14. A population has a mean of μ = 50 and a standard
deviation of o= 10.
a. If 3 points were added to every score in the рори.
lation, what would be the new values for the mean
and standard deviation?
b. If every score in the population were multiplied by
2, then what would be the new values for the mean
and standard deviation?
15. a. After 6 points have been added to every score in
a sample, the mean is found to be M = 70 and the
standard deviation is s 13. What were the values
for the mean and standard deviation for the original
sample?
=
b. After every score in a sample is multiplied by 3,
the mean is found to be M = 48 and the standard
deviation is s = 18. What were the values for
the mean and standard deviation for the original
sample?
16. Compute the mean and standard deviation for the
following sample of n = 4 scores: 82, 88, 82, and 86.
Hint: To simplify the arithmetic, you can subtracted
80 points from each score to obtain a new sample con-
sisting of 2, 8, 2, and 6. Then, compute the mean and
standard deviation for the new sample. Use the values
you obtain to find the mean and standard deviation for
the original sample.
1, U, and 2. THU
deviation for the new sample.
b. Using the values you obtained in part a, what are
the values for the mean and standard deviation for
the original sample?
18. For the following population of N = 6 scores:
2, 9, 6, 8, 9, 8
a. Calculate the range and the standard deviation.
(Use either definition for the range.)
b. Add 2 points to each score and compute the range
and standard deviation again. Describe how adding
a constant to each score influences measures of
variability.
19. The range is completely determined by the two
extreme scores in a distribution. The standard devia-
tion, on the other hand, uses every score.
a. Compute the range (choose either definition) and
the standard deviation for the following sample of
5 scores. Note that there are three scores clus-
tered around the mean in the center of the distribu-
tion, and two extreme values.
n
Scores: 0,
6, 7, 8, 14.
h. Now we will break up the cluster in the center
of the distribution by moving two of the central
scores out to the extremes. Once again compute
the range and the standard deviation.
New scores: 0, 0, 7, 14, 14.
c. According to the range, how do the two distribu-
tions compare in variability? How do they compare
according to the standard deviation?
20. For the data in the following sample:
10, 6, 8, 6, 5
a. Find the mean and the standard deviation.
b. Now change the score of X 10 to X = 0, and
find the new mean and standard deviation.
=
c. Describe how one extreme score influences the
mean and standard deviation.
21. Within a population, the differences that exist from
one person to another are often called diversity.
Expert Solution
This question has been solved!
Explore an expertly crafted, step-by-step solution for a thorough understanding of key concepts.

This is a popular solution

Trending nowThis is a popular solution!

Step by stepSolved in 3 steps with 2 images

Knowledge Booster

Similar questions
Recommended textbooks for you
- Glencoe Algebra 1, Student Edition, 9780079039897...AlgebraISBN:9780079039897Author:CarterPublisher:McGraw Hill
 Holt Mcdougal Larson Pre-algebra: Student Edition...AlgebraISBN:9780547587776Author:HOLT MCDOUGALPublisher:HOLT MCDOUGAL
 Big Ideas Math A Bridge To Success Algebra 1: Stu...AlgebraISBN:9781680331141Author:HOUGHTON MIFFLIN HARCOURTPublisher:Houghton Mifflin Harcourt
  College Algebra (MindTap Course List)AlgebraISBN:9781305652231Author:R. David Gustafson, Jeff HughesPublisher:Cengage Learning
Glencoe Algebra 1, Student Edition, 9780079039897...
Algebra
ISBN:9780079039897
Author:Carter
Publisher:McGraw Hill
Holt Mcdougal Larson Pre-algebra: Student Edition...
Algebra
ISBN:9780547587776
Author:HOLT MCDOUGAL
Publisher:HOLT MCDOUGAL
Big Ideas Math A Bridge To Success Algebra 1: Stu...
Algebra
ISBN:9781680331141
Author:HOUGHTON MIFFLIN HARCOURT
Publisher:Houghton Mifflin Harcourt
College Algebra (MindTap Course List)
Algebra
ISBN:9781305652231
Author:R. David Gustafson, Jeff Hughes
Publisher:Cengage Learning