
MATLAB: An Introduction with Applications
6th Edition
ISBN: 9781119256830
Author: Amos Gilat
Publisher: John Wiley & Sons Inc
expand_more
expand_more
format_list_bulleted
Related questions
Question
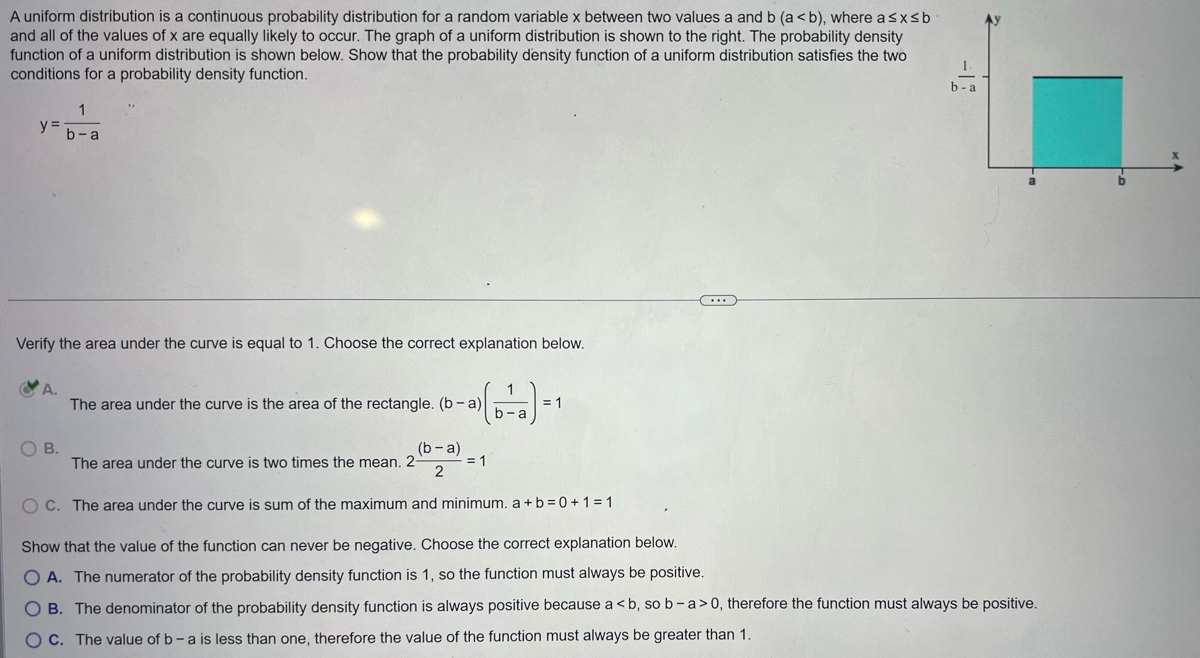

Transcribed Image Text:A uniform distribution is a continuous probability distribution for a random variable x between two values a and b (a <b), where a ≤x≤b
and all of the values of x are equally likely to occur. The graph of a uniform distribution is shown to the right. The probability density
function of a uniform distribution is shown below. Show that the probability density function of a uniform distribution satisfies the two
conditions for a probability density function.
y =
Verify the area under the curve is equal to 1. Choose the correct explanation below.
A.
1
b-a
O B.
The area under the curve is the area of the rectangle. (b-a)
(b-a)
2
OC. The area under the curve is sum of the maximum and minimum. a+b=0+1=1
The area
the curve
times the mean. 2-
(b-a)=
= 1
= 1
1.
b-a
Show that the value of the function can never be negative. Choose the correct explanation below.
O A. The numerator of the probability density function is 1, so the function must always be positive.
OB. The denominator of the probability density function is always positive because a <b, so b-a>0, therefore the function must always be positive.
OC. The value of b - a is less than one, therefore the value of the function must always be greater than 1.
Expert Solution
This question has been solved!
Explore an expertly crafted, step-by-step solution for a thorough understanding of key concepts.

Step by stepSolved in 3 steps with 7 images

Knowledge Booster

Similar questions
- The probability density of a random variable X is given in the figure below. 1 2 From this density, the probability that X is between 0.36 and 1.82 is:arrow_forwardjust q 4 c. use r please thank youarrow_forwardUse the given information to find the indicated probability. A and B are mutually exclusive. P(A) = 0.5, P(B) = 0.4. Find P((A u B)'). P((A u B)') =arrow_forward
- Assume that the machine yields the item selected 90 percent of the time, and returns nothing 10 percent of the time. Three individuals attempt to use the machine. Let X be defined as the number of individuals who obtain the item selected. How many different values are possible for the random variable X? Fill in the table below to complete the probability density function. Be certain to list the values of X in ascending order.arrow_forwardThe probability density of a random variable X is given in the figure below. From this density, the probability that X is between 0.84 and 1.3 is:arrow_forwardFifty people were asked how much they paid for the last smartphone app they purchased. These data were collected. Let the random variable X be the price paid for the app, and let f(x)=P(X=x) be the probability mass function based on the result of this survey. Answer parts a through e below. a) Write f as a set of ordered pairs. (Type an ordered pair, using integers or decimals. Use a comma to separate answers as needed. Do not include the $ symbol in your answer.) Draw the probability distribution as a histogram. Choose the correct histogram below. OA OB. OC. Q Q Q Q Q Q b) Find the cumulative probability function F Price, x $1.00 $2.00 $3.00 $4.00 $5.00 $6.00 $7.00 OD. F(x)= (Type integers or decimals) c) Find f(4). f(4) = (Type an integer or a decimal.) What does f(4) represent? O A. The probability that a randomly selected person did not pay $4 for an app OB. The probability that a randomly selected person paid $4 for an app OC. The probability that a randomly selected person paid…arrow_forward
arrow_back_ios
arrow_forward_ios
Recommended textbooks for you
- MATLAB: An Introduction with ApplicationsStatisticsISBN:9781119256830Author:Amos GilatPublisher:John Wiley & Sons Inc
 Probability and Statistics for Engineering and th...StatisticsISBN:9781305251809Author:Jay L. DevorePublisher:Cengage Learning
 Statistics for The Behavioral Sciences (MindTap C...StatisticsISBN:9781305504912Author:Frederick J Gravetter, Larry B. WallnauPublisher:Cengage Learning
  Elementary Statistics: Picturing the World (7th E...StatisticsISBN:9780134683416Author:Ron Larson, Betsy FarberPublisher:PEARSON
 The Basic Practice of StatisticsStatisticsISBN:9781319042578Author:David S. Moore, William I. Notz, Michael A. FlignerPublisher:W. H. Freeman
 Introduction to the Practice of StatisticsStatisticsISBN:9781319013387Author:David S. Moore, George P. McCabe, Bruce A. CraigPublisher:W. H. Freeman
MATLAB: An Introduction with Applications
Statistics
ISBN:9781119256830
Author:Amos Gilat
Publisher:John Wiley & Sons Inc
Probability and Statistics for Engineering and th...
Statistics
ISBN:9781305251809
Author:Jay L. Devore
Publisher:Cengage Learning
Statistics for The Behavioral Sciences (MindTap C...
Statistics
ISBN:9781305504912
Author:Frederick J Gravetter, Larry B. Wallnau
Publisher:Cengage Learning
Elementary Statistics: Picturing the World (7th E...
Statistics
ISBN:9780134683416
Author:Ron Larson, Betsy Farber
Publisher:PEARSON
The Basic Practice of Statistics
Statistics
ISBN:9781319042578
Author:David S. Moore, William I. Notz, Michael A. Fligner
Publisher:W. H. Freeman
Introduction to the Practice of Statistics
Statistics
ISBN:9781319013387
Author:David S. Moore, George P. McCabe, Bruce A. Craig
Publisher:W. H. Freeman