Chemistry
10th Edition
ISBN: 9781305957404
Author: Steven S. Zumdahl, Susan A. Zumdahl, Donald J. DeCoste
Publisher: Cengage Learning
expand_more
expand_more
format_list_bulleted
Concept explainers
Question
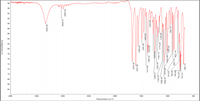
analyze and assign this IR of warfarin

Transcribed Image Text:### Infrared (IR) Spectroscopy Analysis
**Graph Description:**
The provided graph is an IR (Infrared) spectrum, which plots % Transmittance against Wavenumbers (cm^-1). This spectrum is used to identify the functional groups present in a sample by examining the absorption of IR radiation at specific wavenumbers.
**Axes:**
- **X-Axis:** The horizontal axis represents the wavenumbers (cm^-1), ranging from 4000 cm^-1 to 500 cm^-1. Wavenumbers are inversely proportional to wavelength and directly correlate with energy.
- **Y-Axis:** The vertical axis shows the percentage transmittance (% Transmittance), which indicates how much IR radiation passes through the sample. Higher transmittance means less absorption and vice versa.
**Key Features and Peaks:**
- **3339.95 cm^-1:** This peak suggests the presence of an O-H or N-H stretch, typically indicating alcohols, phenols, or amines.
- **3028.37 cm^-1 and 2985.00 cm^-1:** These peaks are indicative of C-H stretches from alkanes or aromatics.
- **1673.39 cm^-1, 1607.49 cm^-1, 1566.20 cm^-1:** Peaks in this region are often associated with C=C stretches in alkenes or aromatic rings, or C=O stretches in carbonyl compounds.
- **Other significant peaks:**
- **1491.80 cm^-1, 1376.00 cm^-1, 1249.57 cm^-1:** Likely represent bending vibrations or secondary structures.
- **1104.45 cm^-1, 1064.67 cm^-1, 1045.67 cm^-1:** May correlate with C-O stretches in alcohols, ethers, carboxylic acids, or esters.
- **1008.29 cm^-1, 871.18 cm^-1, 757.66 cm^-1:** These peaks can correspond to bending vibrations or other functional groups like aromatic compounds.
**Interpretation:**
Each peak on the graph corresponds to a different vibrational mode in the molecule, typically associated with specific types of chemical bonds. By comparing the observed peaks with known reference values, one can deduce the functional groups present in the sample under analysis.
**Usage in Education:**
This graph can be
Expert Solution
This question has been solved!
Explore an expertly crafted, step-by-step solution for a thorough understanding of key concepts.
Step by stepSolved in 2 steps with 1 images

Knowledge Booster
Learn more about
Need a deep-dive on the concept behind this application? Look no further. Learn more about this topic, chemistry and related others by exploring similar questions and additional content below.Similar questions
- What type of antibodies are indicated by a positive peripheral or rim pattern observed on an ANA test? Question 4 options: A) anti-histone antibodies B) anti-dsDNA antibodies C) anti-RNP, SM, or ENA antibodies D) anti-RNA antibodiesarrow_forwardcreat a separation flowchart of Al3+, Sb3+ and Zn2+ without using sulfate or thioacetaminearrow_forwardSolve botharrow_forward
arrow_back_ios
arrow_forward_ios
Recommended textbooks for you
 ChemistryChemistryISBN:9781305957404Author:Steven S. Zumdahl, Susan A. Zumdahl, Donald J. DeCostePublisher:Cengage Learning
 ChemistryChemistryISBN:9781259911156Author:Raymond Chang Dr., Jason Overby ProfessorPublisher:McGraw-Hill Education
 Principles of Instrumental AnalysisChemistryISBN:9781305577213Author:Douglas A. Skoog, F. James Holler, Stanley R. CrouchPublisher:Cengage Learning
 Organic ChemistryChemistryISBN:9780078021558Author:Janice Gorzynski Smith Dr.Publisher:McGraw-Hill Education
 Chemistry: Principles and ReactionsChemistryISBN:9781305079373Author:William L. Masterton, Cecile N. HurleyPublisher:Cengage Learning
 Elementary Principles of Chemical Processes, Bind...ChemistryISBN:9781118431221Author:Richard M. Felder, Ronald W. Rousseau, Lisa G. BullardPublisher:WILEY

Chemistry
Chemistry
ISBN:9781305957404
Author:Steven S. Zumdahl, Susan A. Zumdahl, Donald J. DeCoste
Publisher:Cengage Learning

Chemistry
Chemistry
ISBN:9781259911156
Author:Raymond Chang Dr., Jason Overby Professor
Publisher:McGraw-Hill Education

Principles of Instrumental Analysis
Chemistry
ISBN:9781305577213
Author:Douglas A. Skoog, F. James Holler, Stanley R. Crouch
Publisher:Cengage Learning

Organic Chemistry
Chemistry
ISBN:9780078021558
Author:Janice Gorzynski Smith Dr.
Publisher:McGraw-Hill Education

Chemistry: Principles and Reactions
Chemistry
ISBN:9781305079373
Author:William L. Masterton, Cecile N. Hurley
Publisher:Cengage Learning

Elementary Principles of Chemical Processes, Bind...
Chemistry
ISBN:9781118431221
Author:Richard M. Felder, Ronald W. Rousseau, Lisa G. Bullard
Publisher:WILEY