
Essentials of Business Analytics (MindTap Course List)
2nd Edition
ISBN: 9781305627734
Author: Jeffrey D. Camm, James J. Cochran, Michael J. Fry, Jeffrey W. Ohlmann, David R. Anderson
Publisher: Cengage Learning
expand_more
expand_more
format_list_bulleted
Question
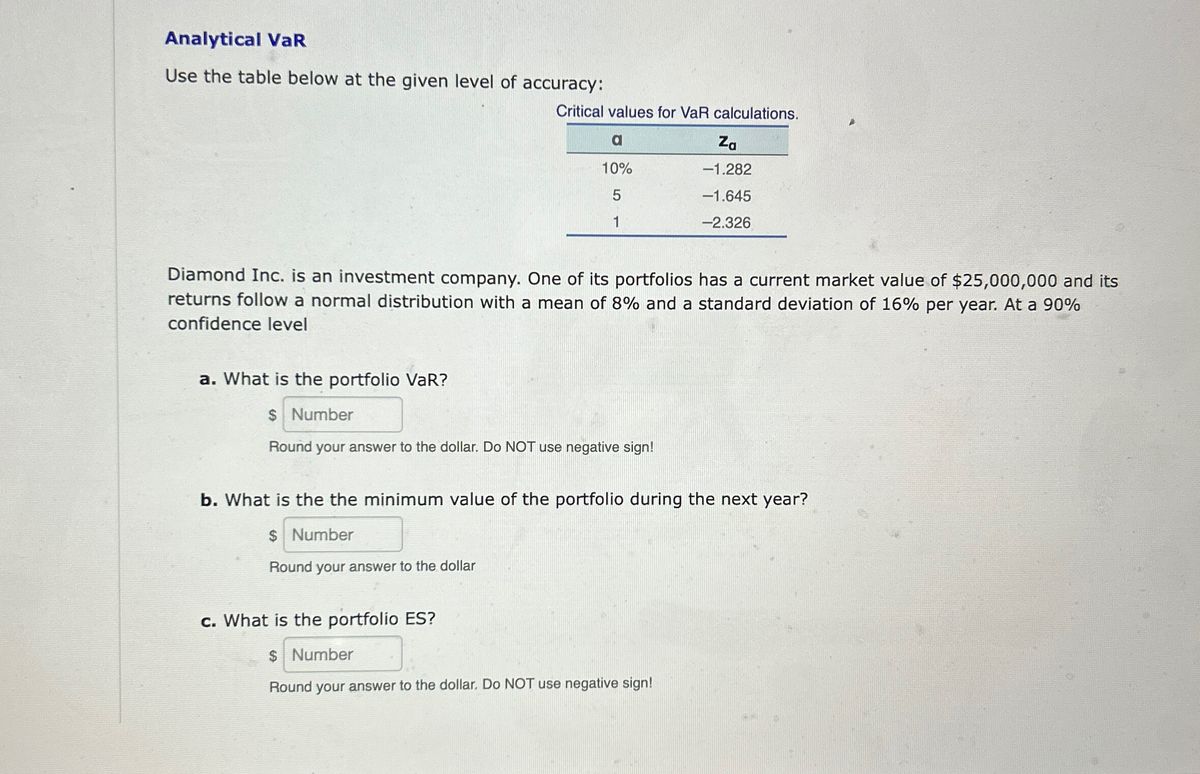

Transcribed Image Text:Analytical VaR
Use the table below at the given level of accuracy:
Critical values for VaR calculations.
a
Za
10%
-1.282
5
-1.645
1
-2.326
Diamond Inc. is an investment company. One of its portfolios has a current market value of $25,000,000 and its
returns follow a normal distribution with a mean of 8% and a standard deviation of 16% per year. At a 90%
confidence level
a. What is the portfolio VaR?
$ Number
Round your answer to the dollar. Do NOT use negative sign!
b. What is the the minimum value of the portfolio during the next year?
$ Number
Round your answer to the dollar
c. What is the portfolio ES?
$ Number
Round your answer to the dollar. Do NOT use negative sign!
Expert Solution
This question has been solved!
Explore an expertly crafted, step-by-step solution for a thorough understanding of key concepts.

Step by stepSolved in 2 steps

Knowledge Booster

Similar questions
- uppose the average return on Asset A is 7.1 percent and the standard deviation is 8.3 percent, and the average return and standard deviation on Asset B are 4.2 percent and 3.6 percent, respectively. Further assume that the returns are normally distributed. Use the NORMDIST function in Excel® to answer the following questions. a. What is the probability that in any given year, the return on Asset A will be greater than 12 percent? Less than 0 percent? (Do not round intermediate calculations and enter your answers as a percent rounded to 2 decimal places, e.g., 32.16.) b. What is the probability that in any given year, the return on Asset B will be greater than 12 percent? Less than 0 percent? (Do not round intermediate calculations and enter your answers as a percent rounded to 2 decimal places, e.g., 32.16.) c-1. In a particular year, the return on Asset A was −4.38 percent. How likely is it that such a low return will recur at some point in the future? (Do not round…arrow_forwardAn asset has an average return of 11.51 percent and a standard deviation of 24.45 percent. What is the most you should expect to lose in any given year with a probability of 2.5 percent? Correct Answer is -37.39 %, just need to know how to get there. This is the correct answer from McGraw Hill Connect.arrow_forwardConsider a position consisting of 200,000 investment in asset A and 300,000 investment in asset B. Assume that the daily volatility of the assets are 1.5% and 1.8% respectively, and that coefficient of correlation between their returns is 0.4. What is the five day 95% VAR for the portfolio (given 95% confidence level represents 1.65 standard deviations on the left side of the normal distribution)?arrow_forward
- Two investments generated the following annual returns: % -Select- a. What is the average annual return on each investment? Round your answers to one decimal place. The average annual rate of return on X: The average annual rate of return on Y: b. What is the standard deviation of the return on investments X and Y? Round your answers to two decimal places. Standard deviation of X: % Standard deviation of Y: c. Based on the standard deviation, which investment was riskier? was riskier. 20X0 20X1 20X2 20X3 20X4 Investment X 11% 22 30 16 9 Investment Y 22% 24 10 13 12arrow_forwardYou have been asked for your advice in selecting a portfolio of assets and have been supplied with the following data:. You have been told that you can create two portfolios-one consisting of assets A and B and the other consisting of assets A and C-by investing equal proportions (50%) in each of the two component assets. a. What is the average expected return, r, for each asset over the 3-year period? b. What is the standard deviation, s, for each asset's expected return? c. What is the average expected return, rp, for each of the portfolios? d. How would you characterize the correlations of returns of the two assets making up each of the portfolios identified in part c? e. What is the standard deviation of expected returns, Sp, for each portfolio? f. What would happen if you constructed a portfolio consisting of assets A, B, and C, equally weighted? Would this reduce risk or enhance return?arrow_forwardSuppose the average return on Asset A is 6.6 percent and the standard deviation is 8.6 percent and the average return and standard deviation on Asset B are 3.8 percent and 3.2 percent, respectively. Further assume that the returns are normally distributed. Use the NORMDIST function in Excel® to answer the following questions. a. What is the probability that in any given year, the return on Asset A will be greater than 11 percent? Less than 0 percent? (Do not round intermediate calculations and enter your answers as a percent rounded to 2 decimal places, e.g., 32.16.) b. What is the probability that in any given year, the return on Asset B will be greater than 11 percent? Less than 0 percent? (Do not round intermediate calculations and enter your answers as a percent rounded to 2 decimal places, e.g., 32.16.) c-1. In a particular year, the return on Asset A was −4.25 percent. How likely is it that such a low return will recur at some point in the future? (Do…arrow_forward
- During a particular investment period, a wealth management company held an investment portfolio that earned an average return of 13% with standard deviation of 30% and beta of 1.5. The average risk-free rate of return during this investment period was 2%. (full process) (a) Calculate the Sharpe and Treynor measures of performance evaluation for this investment portfolio. This investment portfolio is composed of the following two asset classes: Asset Class Weight Return Equity 0.80 15% Bonds 0.20 5% During this particular investment period, the information on a benchmark portfolio is given in the following table. Asset Class Weight Return Equity (S&P500 Index) 0.50 17% Bonds (Lehman Brothers Index) 0.50 5% (b) Determine whether the investment portfolio of the wealth management company performed better than the benchmark portfolio in terms of the total…arrow_forwardSuppose the returns on an asset are normally distributed. The historical average annual return for the asset was 5.2 percent and the standard deviation was 10.6 percent. a. What is the probability that your return on this asset will be less than –9.7 percent in a given year? Use the NORMDIST function in Excel® to answer this question. b. What range of returns would you expect to see 95 percent of the time? c. What range of returns would you expect to see 99 percent of the time?arrow_forwardPlease answer fast I give you upvote.arrow_forward
- Ⓡ Suppose the returns on a particular asset are normally distributed. Also suppose the asset had an average return of 11.1% and a standard deviation of 23.4%. Use the NORMDIST function in Excel to determine the probability that in any given year you will lose money by investing in this asset. (Do not round intermediate calculations and enter your answer as a percent rounded to 2 decimal places, e.g., 32.16.): Probability %arrow_forwardThe expected return and standard deviation of a portfolio that is 60 percent invested in 3 Doors, Incorporated, and 40 percent invested in Down Company are the following: Expected return, E(R) Standard deviation, o Down 3 Doors, Incorporated Company. 118 12% 54 40 What is the standard deviation if the correlation is +1? 0? -1? Note: Do not round intermediate calculations. Enter your answer as a percent rounded to 2 decimal places. Correlation +1 Correlation 01 Correlation-1 Standard Deviation 2.00% 2.00% 2.00 %arrow_forwardPlease solve very soon completely all partsarrow_forward
arrow_back_ios
SEE MORE QUESTIONS
arrow_forward_ios
Recommended textbooks for you
- Essentials of Business Analytics (MindTap Course ...StatisticsISBN:9781305627734Author:Jeffrey D. Camm, James J. Cochran, Michael J. Fry, Jeffrey W. Ohlmann, David R. AndersonPublisher:Cengage Learning
Essentials of Business Analytics (MindTap Course ...
Statistics
ISBN:9781305627734
Author:Jeffrey D. Camm, James J. Cochran, Michael J. Fry, Jeffrey W. Ohlmann, David R. Anderson
Publisher:Cengage Learning