FINANCIAL ACCOUNTING
10th Edition
ISBN: 9781259964947
Author: Libby
Publisher: MCG
expand_more
expand_more
format_list_bulleted
Question

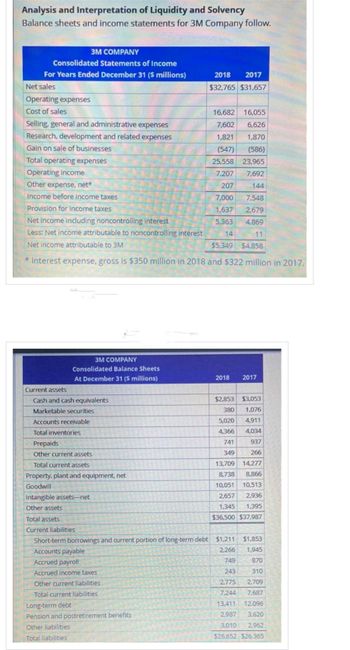
Transcribed Image Text:Analysis and Interpretation of Liquidity and Solvency
Balance sheets and income statements for 3M Company follow.
3M COMPANY
Consolidated Statements of Income
For Years Ended December 31 ($ millions)
Net sales
Operating expenses
Cost of sales
Selling, general and administrative expenses
Research, development and related expenses
Gain on sale of businesses
Total operating expenses
16,682 16,055
7,602 6,626
1,821
1,870
(547)
(586)
25,558 23,965
Operating income
7,207
7,692
Other expense, net*
207
144
Income before income taxes
7,000
7,548
Provision for income taxes
1,637
2,679
Net income including noncontrolling interest
5,363
4,869
Less: Net income attributable to noncontrolling interest
14
11
Net income attributable to 3M
$5,349
$4,858
* Interest expense, gross is $350 million in 2018 and $322 million in 2017.
Current assets
3M COMPANY
Consolidated Balance Sheets
At December 31 ($ millions)
Cash and cash equivalents
Marketable securities
Accounts receivable
Total inventories
Prepaids
Other current assets
Total current assets
Property, plant and equipment, net
Goodwill
Intangible assets-net
Other assets
Total assets
Current liabilities
2018 2017
$32,765 $31,657
Long-term debt
Pension and postretirement benefits
Other liabilities
Total liabilities
2018
2017
$2,853 $3,053
380 1,076
5,020
4,911
4,366 4,034
741
937
349
266
13,709
8,738
10,051 10,513
2,657 2,936
1,345 1,395
$36,500 $37,987
14,277
8,866
Short-term borrowings and current portion of long-term debt $1,211
$1,853
Accounts payable
2,266
1,945
Accrued payroll
749
870
Accrued income taxes
243
310
Other current liabilities
2.775 2,709
Total current liabilities
7,244 7,687
13,411
12,096
2,987
3,620
3,010 2,962
$26,652 $26.365

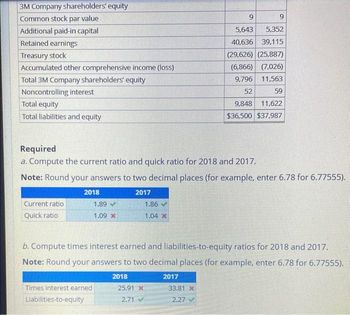
Transcribed Image Text:3M Company shareholders' equity
Common stock par value
Additional paid-in capital
Retained earnings
Treasury stock
Accumulated other comprehensive income (loss)
Total 3M Company shareholders' equity
Noncontrolling interest
Total equity
Total liabilities and equity
Required
a. Compute the current ratio and quick ratio for 2018 and 2017.
Note: Round your answers to two decimal places (for example, enter 6.78 for 6.77555).
2017
Current ratio
Quick ratio
2018
1.89
1.09 x
Times interest earned
Liabilities-to-equity
1.86
1.04 *
b. Compute times interest earned and liabilities-to-equity ratios for 2018 and 2017.
Note: Round your answers to two decimal places (for example, enter 6.78 for 6.77555).
2018
25.91 X
2.71 ✓
9
9
5,643
5,352
40,636 39,115
(29,626) (25,887)
(6,866) (7,026)
9,796 11,563
52
59
9,848 11,622
$36,500 $37,987
2017
33.81 x
2.27
Expert Solution
This question has been solved!
Explore an expertly crafted, step-by-step solution for a thorough understanding of key concepts.
This is a popular solution
Trending nowThis is a popular solution!
Step by stepSolved in 2 steps with 4 images

Knowledge Booster
Learn more about
Need a deep-dive on the concept behind this application? Look no further. Learn more about this topic, accounting and related others by exploring similar questions and additional content below.Similar questions
- Here are comparative financial statement data for Vaughn Company and Mary Company, two competitors. All data are as of December 31, 2022, and December 31, 2021. Net sales Cost of goods sold Operating expenses Interest expense Income tax expense Current assets Plant assets (net) Current liabilities $ Long-term liabilities Common stock, $10 par Retained earnings (a) Vaughn Company Dollars 2022 $1,842,000 1,040,730 268,932 9,210 53,418 323,500 $314,800 520,500 501,500 64,000 109,000 497,500 173,500 $ 2021 74,800 Vaughn Company 91,000 497,500 153,000 Dollars I Condensed Income Statement Percent % 2022 % Mary Company $561,000 297,330 77.979 3,927 Prepare a vertical analysis of the 2022 income statement data for Vaughn Company and Mary Company. (Round percentages to 1 decimal place, e.g. 12.1%) 83,200 6,732 30,600 138,300 125,400 34,000 28,600 Vaughn Company 2021 4 $78,600 117,000 117,000 39,900 $ 24,200 Condensed Income Statement 34,200 Percent Dollars % % % % % % % % % $ Mary Company…arrow_forwardProvided below are the financial statements for J Ltd.: Income statement Balance Sheet Net sales $984 2021 2020 Assets Cost of goods sold $752 Current assets $452 $354 Depreciation $27 Long-term assets $389 $374 EBIT $205 Total assets $841 $728 Interest expense $25 Liabilities and shareholders' equity Current liabilities $247 $164 Income before taxes $180 Long-term debt $157 $145 Taxes $27 Shareholders' equity $437 $419 Net income $153 Total liabilities and shareholders' equity $841 $728 Calculate economic value added (EVA), assuming cost of capital is 7.5%. (Round all the intermediate calculations and the final answer to 2 decimal places) $131.95 $135.70 $98.40 $129.70arrow_forwardComparative financial statement data for Blossom Company and Oriole Company, two competitors, appear below. All balance sheet data are as of December 31, 2022. Net sales. Cost of goods sold Operating expenses Interest expense Income tax expense Current assets Plant assets (net) Current liabilities Long-term liabilities Net cash common by operating activities Capital expenditures Dividends paid on common stock Weighted-average common shares outstanding Blossom Company Oriole Company 2022 Net Income $2,592,000 1,692,000 407,520 9,980 $ 122,500 496,600 766,000 95,500 157,020 198,720 129,600 51,840 80,000 2022 $892,800 489,600 141,120 4,240 51,840 213,840 201,160 (a) Compute the net income and earnings per share for each company for 2022. (Round Earnings per share to 2 decimal places, eg $2.78) Earnings per share 48,600 58,470 51,840 28,800 21,600 50,000arrow_forward
- Below are the Income Statement and Balance Sheet for Palmer Corporation for the years ended 2020 and 2021. Calculate the liquidity ratios in the table to the right for the year ended 2021. Palmer Corporation Comparative Income Statement For the Years Ended December 31, 2021 and 2020 2021 2020 Amount Amount Sales $5,750,900 $4,894,800 Cost of goods sold 3,646,700 3,195,600 Gross profit 2,104,200 1,699,200 Selling expenses 775,500 688,700 Administrative expenses 863,900 815,200 Total operating expenses 1,639,400 1,503,900 Income from operations 464,800 195,300 Other income 102,500 84,600 Income before income tax 567,300 279,900 Income tax expense 200,600 101,200 Net income $366,700 $178,700 Palmer Corporation…arrow_forwardUramilabenarrow_forwardReturn on Assets Ratio and Asset Turnover Ratio Northern Systems reported the following financial data (in millions) in its annual report: Previous Year Current Year Net Income $9,050 $7,500 Net Sales 52,350 37,200 Total Assets 58,734 68,128 If the company’s total assets are $55,676 at the beginning of the previous year, calculate the company’s: (a) return on assets (round answers to one decimal place - ex: 10.7%) (b) asset turnover for both years (round answers to two decimal places) Previous Year Current Year a. Return on Assets Ratio Answer Answer b. Asset Turnover Ratio Answer Answerarrow_forward
- Identify and Compute NOPAT Following is the income statement for Lowe's Companies Inc. LOWE'S COMPANIES INC. Consolidated Statement of Earnings Twelve Months Ended (In millions) Net sales Cost of sales Gross margin Expenses Selling, general and administrative Depreciation and amortization Operating income Interest expense, net Pretax earnings Income tax provision Net earnings Feb. 1, 2019 $114,094 77,442 36,652 27,861 2,363 6,428 998 5,430 1,728 $3,702 Compute its net operating profit after tax (NOPAT) for the 12 months ended February 1, 2019, assuming a 22% total statutory tax rate. Note: Round your answer to the nearest whole dollar (millions). $ 5,014 Xarrow_forwardSelected data from Decco Company are presented below: Total assets $1,600,000 Average assets 2,000,000 Net income 380,000 Net sales 1,500,000 Average common stockholders' equity 1,000,000 Instructions Calculate the following profitability ratios from the above information. 1. Profit margin. 2. Asset turnover. 3. Return on assets.arrow_forwardSales MOSS COMPANY Income Statement For Year Ended December 31, 2021 Cost of goods sold Gross profit Operating expenses (excluding depreciation) Depreciation expense Income before taxes Income taxes expense Net income $ 549,000 357,600 191,400 128,500 49,000 13,900 8,100 $ 5,800 MOSS COMPANY Selected Balance Sheet Information At December 31 2021 2020 Current assets Cash $ 91,150 $ 33,300 Accounts receivable 31,500 45,000 66,500 55,400 Current liabilities 43,400 32,200 2,700 3,500 Inventory Accounts payable Income taxes payable Use the information above to calculate cash flows from operating activities using the indirect method. Note: Amounts to be deducted should be indicated by a minus sign. Cash flows from operating activities: Adjustments to reconcile net income to net cash provided by operating activities Income statement items not affecting cash Changes in current operating assets and liabilities $ 49,000 49,000 $ 49,000arrow_forward
- Selected data from the financial statements of Rags to Riches are provided below: Current Year Prior Year Accounts Receivable $120,000 $ 76,000 Inventory 24,000 32,000 Total Assets 900,000 760,000 Net Sales 760,000 540,000 Cost of Goods Sold 320,000 420,000 Which of the following would result from vertical analysis of the company's income statement? a. The accounts receivable turnover ratio is 7.76 in the current year. b. Gross profit is 57.9% of net sales for the current year. c. Net sales are 84.4% of total assets for the current year. d. Cost of goods sold decreased by $50,000 or 23.8% duringarrow_forwardLydex Company’s financial statements for the last two years are as follows: Lydex Company Comparative Balance Sheet This Year Last Year Assets Current assets: Cash $ 1,020,000 $ 1,260,000 Marketable securities 0 300,000 Accounts receivable, net 2,940,000 2,040,000 Inventory 3,660,000 2,100,000 Prepaid expenses 270,000 210,000 Total current assets 7,890,000 5,910,000 Plant and equipment, net 9,640,000 9,110,000 Total assets $ 17,530,000 $ 15,020,000 Liabilities and Stockholders' Equity Liabilities: Current liabilities $ 4,070,000 $ 3,100,000 Note payable, 10% 3,700,000 3,100,000 Total liabilities 7,770,000 6,200,000 Stockholders' equity: Common stock, $75 par value 7,500,000 7,500,000 Retained earnings 2,260,000 1,320,000 Total stockholders' equity 9,760,000 8,820,000 Total liabilities and stockholders' equity $ 17,530,000 $ 15,020,000 Lydex Company Comparative Income Statement and Reconciliation This…arrow_forwardAnalysis and Interpretation of ProfitabilityBalance sheets and income statements for 3M Company follow. 3M COMPANY Consolidated Statements of Income For Years ended December 31 ($ millions) 2018 2017 Net sales $32,765 $31,657 Operating expenses Cost of sales 16,682 16,055 Selling, general and administrative expenses 7,602 6,626 Research, development and related expenses 1,821 1,870 Gain on sale of businesses (547) (586) Total operating expenses 25,558 23,965 Operating income 7,207 7,692 Other expense, net* 207 144 Income before income taxes 7,000 7,548 Provision for income taxes 1,637 2,679 Net income including noncontrolling interest 5,363 4,869 Less: Net income attributable to noncontrolling interest 14 11 Net income attributable to 3M $ 5,349 $ 4,858 *Interest expense, gross $350 million in 2018 and $322 million in 2017. 3M COMPANY Consolidated Balance Sheets At December 31 ($ millions, except per share amount) 2018 2017…arrow_forward
arrow_back_ios
SEE MORE QUESTIONS
arrow_forward_ios
Recommended textbooks for you

 AccountingAccountingISBN:9781337272094Author:WARREN, Carl S., Reeve, James M., Duchac, Jonathan E.Publisher:Cengage Learning,
 Accounting Information SystemsAccountingISBN:9781337619202Author:Hall, James A.Publisher:Cengage Learning,
 Horngren's Cost Accounting: A Managerial Emphasis...AccountingISBN:9780134475585Author:Srikant M. Datar, Madhav V. RajanPublisher:PEARSON
 Intermediate AccountingAccountingISBN:9781259722660Author:J. David Spiceland, Mark W. Nelson, Wayne M ThomasPublisher:McGraw-Hill Education
 Financial and Managerial AccountingAccountingISBN:9781259726705Author:John J Wild, Ken W. Shaw, Barbara Chiappetta Fundamental Accounting PrinciplesPublisher:McGraw-Hill Education


Accounting
Accounting
ISBN:9781337272094
Author:WARREN, Carl S., Reeve, James M., Duchac, Jonathan E.
Publisher:Cengage Learning,

Accounting Information Systems
Accounting
ISBN:9781337619202
Author:Hall, James A.
Publisher:Cengage Learning,

Horngren's Cost Accounting: A Managerial Emphasis...
Accounting
ISBN:9780134475585
Author:Srikant M. Datar, Madhav V. Rajan
Publisher:PEARSON

Intermediate Accounting
Accounting
ISBN:9781259722660
Author:J. David Spiceland, Mark W. Nelson, Wayne M Thomas
Publisher:McGraw-Hill Education

Financial and Managerial Accounting
Accounting
ISBN:9781259726705
Author:John J Wild, Ken W. Shaw, Barbara Chiappetta Fundamental Accounting Principles
Publisher:McGraw-Hill Education