
MATLAB: An Introduction with Applications
6th Edition
ISBN: 9781119256830
Author: Amos Gilat
Publisher: John Wiley & Sons Inc
expand_more
expand_more
format_list_bulleted
Related questions
Question
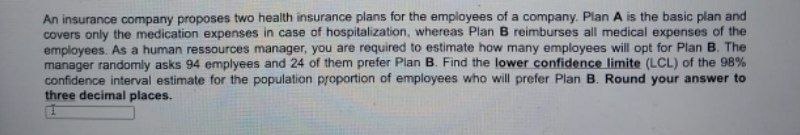

Transcribed Image Text:An insurance company proposes two health insurance plans for the employees of a company. Plan A is the basic plan and
covers only the medication expenses in case of hospitalization, whereas Plan B reimburses all medical expenses of the
employees. As a human ressources manager, you are required to estimate how many employees will opt for Plan B. The
manager randomly asks 94 emplyees and 24 of them prefer Plan B. Find the lower confidence limite (LCL) of the 98%
confidence interval estimate for the population proportion of employees who will prefer Plan B. Round your answer to
three decimal places.
Expert Solution
This question has been solved!
Explore an expertly crafted, step-by-step solution for a thorough understanding of key concepts.

Step by stepSolved in 2 steps with 2 images

Knowledge Booster

Similar questions
- In a random sample of 400 adults in a small town, 189 of them participated in some form of adult education. Find a 98% confidence interval for the population proportion of adults in the town who participate in adult educationarrow_forwardAt one large college, 660 out of the 1500 students surveyed said they plan to take another science class.Find the 95% confidence interval for the proportion of students that said they plan to take another science class.arrow_forwardA political researcher takes a survey of 310 randomly selected registered voters in Orlando, and each person was asked who they plan on voting for in the 2024 presidential election. 110 said they plan on voting for Candidate A, 185 said they plan on voting for Candidate B, and 15 were unsure or plan to vote for another candidate. The researcher wants to construct a 95% confidence interval for the proportion of all registered voters in Orlando who plan to vote for Candidate B. What is the point estimate? Round final answer to 3 decimal places.arrow_forward
- A statistics professor at a major university asked her students whether or not they wereregistered to vote. In a sample of 50 of the randomly sampled statistics students (from over1000 students), 35 said they were registered to vote. Find a 98% confidence interval and makea conclusion based upon those results.arrow_forwardThe last poll of 144 voters in Iowa shows that 19% of voters will vote for him in the Iowa Presidential Caucus. What is the 99% confidence interval of his support level in Iowa?arrow_forwardIn a survey, 545 college students are randomly selected and asked whether or not they own a car. Of those surveyed, it is found that 210 own a car. Use this data to find a 99% confidence interval for the true proportion of all college students who own a car.arrow_forward
- The personality characteristics of business leaders (e.g., CEOS) are related to the operations of the businesses that they lead (Oreg & Berson, 2018). Traits like openness to experience are related to positive financial outcomes and other traits are related to negative financial outcomes for their businesses. Suppose that a board of directors is interested in evaluating the personality of their leadership. Among a sample of n = 16 managers, the sample mean of the openness to experiences dimension of personality was M = 4.50. Assuming that u = 4.24 and o = 1.05 (Cobb-Clark & Schurer, 2012), use a two-tailed hypothesis test with a = .05 to test the hypothesis that this company's business leaders' openness to experience is different from the population. Standard Normal Distribution Mean - 0.0 Standard Deviation 1.0 .7198 .1401 .1401 -3.0 -2.0 -1.0 0.0 1.0 2.0 3.0 -1.08 1.08 Step 1. Ho: ; H;: a = .05. Step 2. The critical region consists of Step 3. For these data the standard error is and…arrow_forwardWildlife biologists inspect 180 deer taken by hunters and find 36 of them carrying Lyme disease ticks. Calculate a 95% confidence interval for the proportion of deer that carry Lyme disease ticks.arrow_forwardA dowser has correctly located water for a well 1 out of 2 times in Jones County. In Jones County, someone who is just guessing has a 40% chance of locating water for a well. Does this sample provide sufficient evidence that the dowser can locate water and is not just guessing?arrow_forward
- A statistics student wants to conduct a study to determine the proportion of workers in Cititon who commute to another town for work. If the student wants a 90% confidence interval with a margin of error of 2%, how many workers should be in her sample?arrow_forwardA doctor wanted to study the effect of four different treatments on mental health. A group of 100 adults experiencing depression volunteered for the study. The doctor randomly assigned one-fourth of them to each of four groups. Group 1 followed a specific exercise plan, group 2 followed a specific diet plan, group 3 followed an exercise and diet plan, and group 4 did not follow any plan. After 4 weeks, the doctor contacted each participant and asked them if they felt any better. The results are displayed in the table. The doctor would like to know if these data provide convincing evidence that the distribution of responses differs across the treatment groups in the population of all patients like these. The random condition is met. The 10% condition is not needed because random sampling did not take place. This table of expected counts shows that all expected counts are at least 5. What is the value of the chi-square test statistic? χ‑2 = 5.03 χ‑2 = 6.26 χ‑2 = 25.33 χ‑2 = 39.22arrow_forward
arrow_back_ios
arrow_forward_ios
Recommended textbooks for you
- MATLAB: An Introduction with ApplicationsStatisticsISBN:9781119256830Author:Amos GilatPublisher:John Wiley & Sons Inc
 Probability and Statistics for Engineering and th...StatisticsISBN:9781305251809Author:Jay L. DevorePublisher:Cengage Learning
 Statistics for The Behavioral Sciences (MindTap C...StatisticsISBN:9781305504912Author:Frederick J Gravetter, Larry B. WallnauPublisher:Cengage Learning
  Elementary Statistics: Picturing the World (7th E...StatisticsISBN:9780134683416Author:Ron Larson, Betsy FarberPublisher:PEARSON
 The Basic Practice of StatisticsStatisticsISBN:9781319042578Author:David S. Moore, William I. Notz, Michael A. FlignerPublisher:W. H. Freeman
 Introduction to the Practice of StatisticsStatisticsISBN:9781319013387Author:David S. Moore, George P. McCabe, Bruce A. CraigPublisher:W. H. Freeman
MATLAB: An Introduction with Applications
Statistics
ISBN:9781119256830
Author:Amos Gilat
Publisher:John Wiley & Sons Inc
Probability and Statistics for Engineering and th...
Statistics
ISBN:9781305251809
Author:Jay L. Devore
Publisher:Cengage Learning
Statistics for The Behavioral Sciences (MindTap C...
Statistics
ISBN:9781305504912
Author:Frederick J Gravetter, Larry B. Wallnau
Publisher:Cengage Learning
Elementary Statistics: Picturing the World (7th E...
Statistics
ISBN:9780134683416
Author:Ron Larson, Betsy Farber
Publisher:PEARSON
The Basic Practice of Statistics
Statistics
ISBN:9781319042578
Author:David S. Moore, William I. Notz, Michael A. Fligner
Publisher:W. H. Freeman
Introduction to the Practice of Statistics
Statistics
ISBN:9781319013387
Author:David S. Moore, George P. McCabe, Bruce A. Craig
Publisher:W. H. Freeman