
MATLAB: An Introduction with Applications
6th Edition
ISBN: 9781119256830
Author: Amos Gilat
Publisher: John Wiley & Sons Inc
expand_more
expand_more
format_list_bulleted
Related questions
Concept explainers
Question
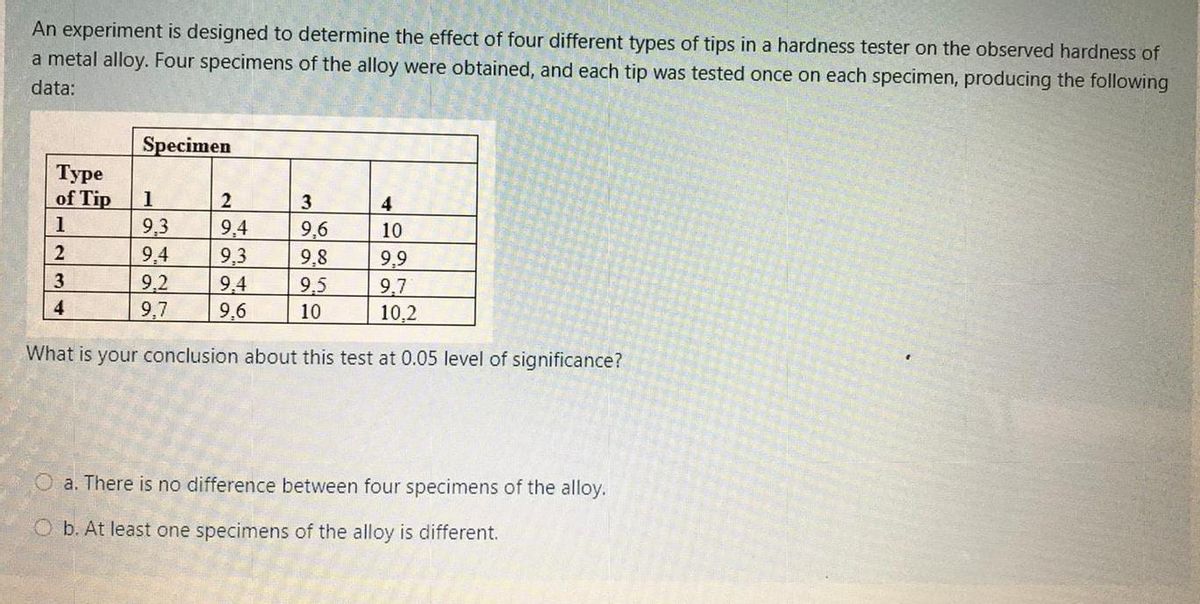

Transcribed Image Text:An experiment is designed to determine the effect of four different types of tips in a hardness tester on the observed hardness of
a metal alloy. Four specimens of the alloy were obtained, and each tip was tested once on each specimen, producing the following
data:
Specimen
Туре
of Tip
4
9,3
9,4
9,2
9,7
9,4
9,6
9,8
9,5
10
9,3
9,4
9,6
9,9
9,7
10,2
3
4
10
What is your conclusion about this test at 0.05 level of significance?
a. There is no difference between four specimens of the alloy.
O b. At least one specimens of the alloy is different.
Expert Solution
This question has been solved!
Explore an expertly crafted, step-by-step solution for a thorough understanding of key concepts.

This is a popular solution

Trending nowThis is a popular solution!

Step by stepSolved in 2 steps

Knowledge Booster


Learn more about
Need a deep-dive on the concept behind this application? Look no further. Learn more about this topic, statistics and related others by exploring similar questions and additional content below.Similar questions
- An experiment was conducted to test the effects of five different diets (A-E) in turkeys. Six turkeys were randomly assigned to each of the five different diet groups (Diet) and were fed for a fixed period of time. The weight gained in pounds was recorded for each turkey and the data was entered into R for analysis. R produced the following output. Between Within Total a. له له له م په b. C. d. e. Sum-of-squares (SS) Degrees of freedom Mean square (MS) ?? (b) 103.04 ???.?? (a) 110.9249 25 29 ????.??? (c) ????.??? (d) Find the sum-of-squares for within-group variability. Find the degrees of freedom for between-group variability. Find the mean-square of the between-group variability. F-statistic ??.????? p-value ????.??? (e) Find the mean-square of the within-group variability. Find the p-value for the ANOVA F-test. What is the conclusion? Are the means of the five diets significantly different?arrow_forwardThe following data was reported on total Fe for four types of iron formation (1 carbonate, 2 silicate, 3 magnetite, 4 hematite). 1: 21.0 28.1 27.8 27.0 27,8 25.2 25.3 27.1 20.5 31.5 2: 26.2 24.0 26.2 20.2 23.6 34.0 17.1 26.8 23.7 25.0 3: 29.6 34.0 27.5 29.4 26.4 26.2 29.9 29.5 30.0 35.5 4: 37.1 44,2 34.1 30.3 31.8 33.134.1 32.9 36,3 25.3 A USE SALT Carry out an analysis of variance F test at significance level 0.01. State the appropriate hypotheses. H at least two 's are equal Ho Hi= Ha = H4 H at least two 's are unequal O Ho = = 4 H al four s are unequal H all four 's are equalarrow_forward23453 An experiment is designed to determine the effect of four different types of tips in a hardness tester on the observed hardness of a metal alloy. Four specimens of the alloy were obtained, and each tip was tested once on each specimen, producing the following data: Specimen Туре of Tip 1 3 1 9,3 9,4 9,6 10 9,4 9,3 9,8 9,9 3 9,2 9,7 9,4 9,6 9,5 9,7 10,2 4 10 What is the appropriate null and alternative hypotheses? O a. Ho: H1 = H2 = H3 = H4 H: At least one u; is different O b. Ho: H1 = H2 = H3 = H4 = 0 H: At least ome u; + 0 O c. Ho: T1 = T2 = T3 = T4 H: At least one t, is different O d. Ho: H1 = 42 = H3 H: At least one u, = 0arrow_forward
- Rhino viruses typically cause common colds. In a test of the effectiveness of echinacea, 33 of the 38 subjects treated with echinacea developed rhinovirus infections. In a placebo group, 94 of the 111 subjects developed rhinovirus infections. Use a 0.01 significance level to test the claim that echinacea has an effect on rhinovirus infections. Complete parts (a) through (c) below. a. Test the claim using a hypothesis test. Consider the first sample to be the sample of subjects treated with echinacea and the second sample to be the sample of subjects treated with a placebo. What are the null and alternative hypotheses for the hypothesis test? O A. Ho: P1 #P2 Hy:P1 =P2 O B. Ho: P1 =P2 H1: P1 P2 H1: P1 #P2 Identify the test statistic. (Round to two decimal places as needed.) Identify the P-value. P-value = (Round to three decimal places as needed.) What is the conclusion based on the hypothesis test? the null hypothesis. There sufficient evidence to support the claim that echinacea…arrow_forwardThe following is a list of 6 measurements. 11, 17, 7, 8, 16, 20 Send data to calculator Suppose that these 6 measurements are respectively labeled x,, x,, ..., X6: Compute the following. i = 1 ?arrow_forwardAnswer all questions. Please do not copy from other posts:arrow_forward
arrow_back_ios
arrow_forward_ios
Recommended textbooks for you
- MATLAB: An Introduction with ApplicationsStatisticsISBN:9781119256830Author:Amos GilatPublisher:John Wiley & Sons Inc
 Probability and Statistics for Engineering and th...StatisticsISBN:9781305251809Author:Jay L. DevorePublisher:Cengage Learning
 Statistics for The Behavioral Sciences (MindTap C...StatisticsISBN:9781305504912Author:Frederick J Gravetter, Larry B. WallnauPublisher:Cengage Learning
  Elementary Statistics: Picturing the World (7th E...StatisticsISBN:9780134683416Author:Ron Larson, Betsy FarberPublisher:PEARSON
 The Basic Practice of StatisticsStatisticsISBN:9781319042578Author:David S. Moore, William I. Notz, Michael A. FlignerPublisher:W. H. Freeman
 Introduction to the Practice of StatisticsStatisticsISBN:9781319013387Author:David S. Moore, George P. McCabe, Bruce A. CraigPublisher:W. H. Freeman
MATLAB: An Introduction with Applications
Statistics
ISBN:9781119256830
Author:Amos Gilat
Publisher:John Wiley & Sons Inc
Probability and Statistics for Engineering and th...
Statistics
ISBN:9781305251809
Author:Jay L. Devore
Publisher:Cengage Learning
Statistics for The Behavioral Sciences (MindTap C...
Statistics
ISBN:9781305504912
Author:Frederick J Gravetter, Larry B. Wallnau
Publisher:Cengage Learning
Elementary Statistics: Picturing the World (7th E...
Statistics
ISBN:9780134683416
Author:Ron Larson, Betsy Farber
Publisher:PEARSON
The Basic Practice of Statistics
Statistics
ISBN:9781319042578
Author:David S. Moore, William I. Notz, Michael A. Fligner
Publisher:W. H. Freeman
Introduction to the Practice of Statistics
Statistics
ISBN:9781319013387
Author:David S. Moore, George P. McCabe, Bruce A. Craig
Publisher:W. H. Freeman