
MATLAB: An Introduction with Applications
6th Edition
ISBN: 9781119256830
Author: Amos Gilat
Publisher: John Wiley & Sons Inc
expand_more
expand_more
format_list_bulleted
Related questions
Question
I just need help with the last portion of these questions.
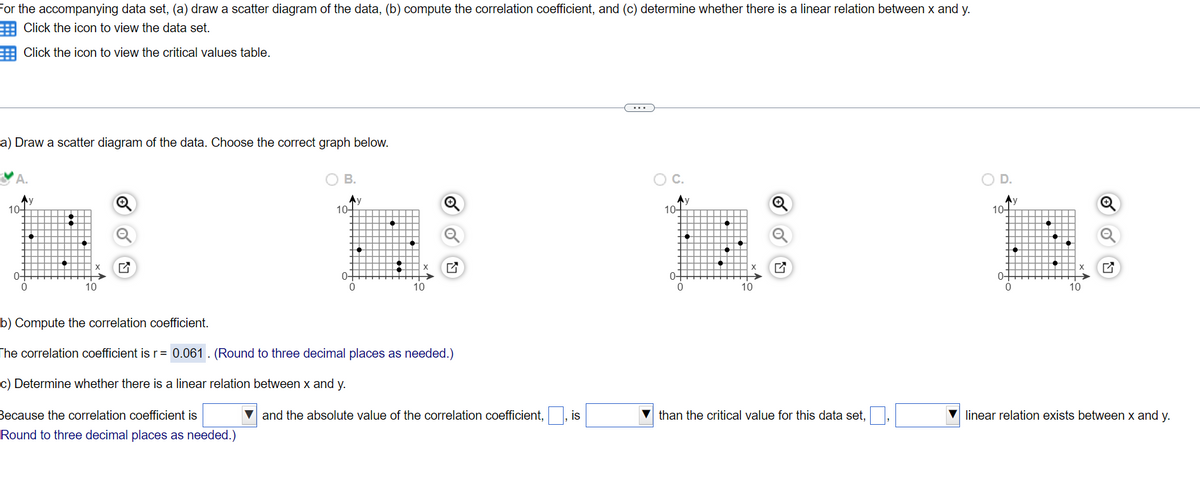

Transcribed Image Text:For the accompanying data set, (a) draw a scatter diagram of the data, (b) compute the correlation coefficient, and (c) determine whether there is a linear relation between x and y.
Click the icon to view the data set.
Click the icon to view the critical values table.
a) Draw a scatter diagram of the data. Choose the correct graph below.
10+
0-
0
10
B.
Ay
10+
0-
10
Q
b) Compute the correlation coefficient.
The correlation coefficient is r = 0.061. (Round to three decimal places as needed.)
c) Determine whether there is a linear relation between x and y.
Because the correlation coefficient is
Round to three decimal places as needed.)
and the absolute value of the correlation coefficient,, is
Ay
10-
0
10
than the critical value for this data set,
D.
Av
10+
0-
0
linear relation exists between x and y.

Transcribed Image Text:An engineer wanted to determine how the weight of a car affects gas mileage. The following data represent the weight
of various cars and their gas mileage. Complete parts (a) through (d).
Car
A
B
C
D
E
Click the icon to view the critical values table.
Weight Miles per
(pounds)
Gallon
2655
26
3340
21
3310
19
3100
21
3180
23
-C
(b) Draw a scatter diagram of the data. Choose the correct scatter plot.
OA.
mpg
The explanatory variable is the weight and the response variable is the miles per gallon.
The explanatory variable is the miles per gallon and the response variable is the weight.
Weight (lbs)
30-
15+
2500
4000
Weight (lbs)
4000-
2500+
15
::.
mpg
30
Q
r-.879
(Round to three decimal places as needed.)
Weight (lbs)
6du
Because the correlation coefficient is
than the critical value for this data set,
weight of a car and its miles per gallon.
(Round to three decimal places as needed.)
B.
4000-
2500+
30-
15-
15
2500
··
mpg
"
30
4000
Weight (lbs)
(c) Compute the linear correlation coefficient between the weight of a car and its miles per gallon.
Q
(d) Comment on the type of relation that appears to exist between the weight of a car and its miles per
gallon based on the scatter diagram and the linear correlation coefficient.
and the absolute value of the correlation coefficient, is
linear relation exists between the
Expert Solution
This question has been solved!
Explore an expertly crafted, step-by-step solution for a thorough understanding of key concepts.

This is a popular solution

Trending nowThis is a popular solution!

Step by stepSolved in 3 steps with 2 images

Knowledge Booster

Similar questions
- this the whole question.arrow_forwardFind the number of ways that 6 teachers can be assigned to 4 sections of an introductory psychology course if no teacher is assigned to more than one section.arrow_forwardThe average age of all high school-educated workers is $41,000. The average salary of all college workers is $45,000. What can we say about the average salary of all high school and college-educated workers? It must be $43,000. It could be any number between $41,000 and $45,000 It could be any number between $35,000 and $41,000 Not enough information is givenarrow_forward
- I am stuck on this problem. I have completed the first two parts however, I am unsure if the answers are correct. Can you confirm if my answers are correct and how would I approach the rest of the problem?arrow_forwardThrough conversations like these parents and children can begin to find some middle ground. What is the correct way to edit this sentence?arrow_forwardI know there isn't the full questions but there is only two available spotsarrow_forward
- You have been named the Good Reader in your town’s reading club. You’re invited to give a 15-minute speech at the annual reception. You want to spend the speech talking about three themes; (1) how you came to love books, (2) the camaraderie you feel in the club, and (3) your long-term goals for encouraging reading in the town. You would like to spend at least 2 minutes talking about each theme. How many ways can you segment your time so that you talk enough about each theme? Note that you should assume the number of minutes you spend talking about each theme is a natural number. One example of a valid breakdown is 3 minutes on theme 1, 5 minutes on them 2, and 7 minutes on theme 3. Describe how you arrived at your solution.arrow_forwardNo need for thorough Explanation. Twenty students in a group of 40 at UB High enrolled in Science. Eleven students enrolled in Latin. Five students enrolled for both courses. Answer the questions. How many students have not opted to enroll for either of the two courses? How many students enrolled in science only. Find the number of students who have opted to study at least one of the two courses. How many students enrolled in Latin onlyarrow_forwardThere are 10 questions on a discrete mathematics final exam. How many ways are there to assign scores to the problems if the sum of the scores is 100 and each question is worth at least 5 points?arrow_forward
arrow_back_ios
SEE MORE QUESTIONS
arrow_forward_ios
Recommended textbooks for you
- MATLAB: An Introduction with ApplicationsStatisticsISBN:9781119256830Author:Amos GilatPublisher:John Wiley & Sons Inc
 Probability and Statistics for Engineering and th...StatisticsISBN:9781305251809Author:Jay L. DevorePublisher:Cengage Learning
 Statistics for The Behavioral Sciences (MindTap C...StatisticsISBN:9781305504912Author:Frederick J Gravetter, Larry B. WallnauPublisher:Cengage Learning
  Elementary Statistics: Picturing the World (7th E...StatisticsISBN:9780134683416Author:Ron Larson, Betsy FarberPublisher:PEARSON
 The Basic Practice of StatisticsStatisticsISBN:9781319042578Author:David S. Moore, William I. Notz, Michael A. FlignerPublisher:W. H. Freeman
 Introduction to the Practice of StatisticsStatisticsISBN:9781319013387Author:David S. Moore, George P. McCabe, Bruce A. CraigPublisher:W. H. Freeman
MATLAB: An Introduction with Applications
Statistics
ISBN:9781119256830
Author:Amos Gilat
Publisher:John Wiley & Sons Inc
Probability and Statistics for Engineering and th...
Statistics
ISBN:9781305251809
Author:Jay L. Devore
Publisher:Cengage Learning
Statistics for The Behavioral Sciences (MindTap C...
Statistics
ISBN:9781305504912
Author:Frederick J Gravetter, Larry B. Wallnau
Publisher:Cengage Learning
Elementary Statistics: Picturing the World (7th E...
Statistics
ISBN:9780134683416
Author:Ron Larson, Betsy Farber
Publisher:PEARSON
The Basic Practice of Statistics
Statistics
ISBN:9781319042578
Author:David S. Moore, William I. Notz, Michael A. Fligner
Publisher:W. H. Freeman
Introduction to the Practice of Statistics
Statistics
ISBN:9781319013387
Author:David S. Moore, George P. McCabe, Bruce A. Craig
Publisher:W. H. Freeman