MATLAB: An Introduction with Applications
6th Edition
ISBN: 9781119256830
Author: Amos Gilat
Publisher: John Wiley & Sons Inc
expand_more
expand_more
format_list_bulleted
Question

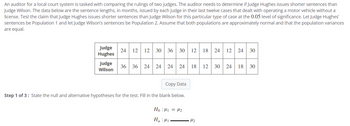
Transcribed Image Text:An auditor for a local court system is tasked with comparing the rulings of two judges. The auditor needs to determine if Judge Hughes issues shorter sentences than
Judge Wilson. The data below are the sentence lengths, in months, issued by each judge in their last twelve cases that dealt with operating a motor vehicle without a
license. Test the claim that Judge Hughes issues shorter sentences than Judge Wilson for this particular type of case at the 0.05 level of significance. Let Judge Hughes'
sentences be Population 1 and let Judge Wilson's sentences be Population 2. Assume that both populations are approximately normal and that the population variances
are equal.
Judge
Hughes
Judge
Wilson
24 12 12 30 36 30 12
36 36 24
24
24 24 18 12
Copy Data
Step 1 of 3: State the null and alternative hypotheses for the test. Fill in the blank below.
Ho:₁ = ₂
Ha: M
18 24 12 24 30
•H₂
24 18 30
SAVE
AI-Generated Solution
info
AI-generated content may present inaccurate or offensive content that does not represent bartleby’s views.
Unlock instant AI solutions
Tap the button
to generate a solution
to generate a solution
Click the button to generate
a solution
a solution
Knowledge Booster
Similar questions
- Please apply table to question. Thanks!arrow_forwardThe Bureau of Labor Statistics reports that the official unemployment rate for Black people was 10.4% and 4.7% for White people in February 2015. Select all correct answers for this question. O The samples of white and black people are independent. The explanatory variable is the unemployment rate. The response variable is the unemployment rate. The response variable is race.arrow_forwardA congressperson wants to come up with a single value to describe the prices of homes in their district. However, their district consists of a few homes that are extremely expensive compared to the others. Which descriptive statistic should they use? a. Range b. Mode c. Median d. Meanarrow_forward
- fill blanks underlines.arrow_forwardClassify each of the following data types as qualitative or quantitative. 1. Types of animals used as NFL football team mascots 2. Weight of kindergarten students 3. Height of sycamore trees 4. Dollars earned by actor 5. Colors people use to paint their housesarrow_forwardA statistics content developer at Aplia wanted to know whether study skills are related to memory quality. She invited student volunteers to perform an online memory task. The students saw a list of 60 words and were then asked to recognize a list of 10 words that were on the original list. Students were also asked to provide their GPAs. Consider the following data set, which was collected from student volunteers in 2009. The table gives the frequency for five intervals of scores on the number of correctly identified words. Use the dropdown menus to complete the table by filling in the missing values for the proportions and percentages. Score Interval f Proportion Percentage 9–10 29 0.19 19% 7–8 53 5–6 50 3–4 22 0.14 14% 1–2 1 0.01 1%arrow_forward
arrow_back_ios
arrow_forward_ios
Recommended textbooks for you
 MATLAB: An Introduction with ApplicationsStatisticsISBN:9781119256830Author:Amos GilatPublisher:John Wiley & Sons Inc
 Probability and Statistics for Engineering and th...StatisticsISBN:9781305251809Author:Jay L. DevorePublisher:Cengage Learning
 Statistics for The Behavioral Sciences (MindTap C...StatisticsISBN:9781305504912Author:Frederick J Gravetter, Larry B. WallnauPublisher:Cengage Learning
 Elementary Statistics: Picturing the World (7th E...StatisticsISBN:9780134683416Author:Ron Larson, Betsy FarberPublisher:PEARSON
 The Basic Practice of StatisticsStatisticsISBN:9781319042578Author:David S. Moore, William I. Notz, Michael A. FlignerPublisher:W. H. Freeman
 Introduction to the Practice of StatisticsStatisticsISBN:9781319013387Author:David S. Moore, George P. McCabe, Bruce A. CraigPublisher:W. H. Freeman

MATLAB: An Introduction with Applications
Statistics
ISBN:9781119256830
Author:Amos Gilat
Publisher:John Wiley & Sons Inc

Probability and Statistics for Engineering and th...
Statistics
ISBN:9781305251809
Author:Jay L. Devore
Publisher:Cengage Learning

Statistics for The Behavioral Sciences (MindTap C...
Statistics
ISBN:9781305504912
Author:Frederick J Gravetter, Larry B. Wallnau
Publisher:Cengage Learning

Elementary Statistics: Picturing the World (7th E...
Statistics
ISBN:9780134683416
Author:Ron Larson, Betsy Farber
Publisher:PEARSON

The Basic Practice of Statistics
Statistics
ISBN:9781319042578
Author:David S. Moore, William I. Notz, Michael A. Fligner
Publisher:W. H. Freeman

Introduction to the Practice of Statistics
Statistics
ISBN:9781319013387
Author:David S. Moore, George P. McCabe, Bruce A. Craig
Publisher:W. H. Freeman