An artide in the ACI Materials Journal (Vol. 84, 1987, pp. 213-216) describes several experiments investigating the rodding of concrete to remove trapped air. A 3-inch x 6-inch cylinder was used, and the number of times this rod was used is the design variable. The resulting compressive strength of the concrete specimen is the response. The data are shown in the following table. Compressive Strength (psi) Rodding Level Observations 10 1530 1530 1440 15 1610 1650 1500 20 1560 1730 1530 25 1500 1490 1510 Calculate the test statistic fo Input answer up to 2 decimal places. Test Statisticf = Blank 1
Q: A professional body wishes to analyse the performance of its students on a particular two-part…
A: Given observation X Y X2 Y2 XY 82 76 6724 5776 6232 49 58 2401…
Q: In an article in IEEE Transactions on Instrumentation and Measurement (2001, Vol. 50, pp. 986-990),…
A:
Q: An articde in the ACI Materials Journal (val. 84, 1987, pp. 213-216) describes several experiments…
A: F test is used to make conclusions in the anova table. Anova table is used to measure the mean…
Q: An engineer tested nine samples of each of three designs of a certain bearing for a new electrical…
A: The average failure time for design A is: TA=16+16+53+21+17+25+30+21+459=27.1111 The average failure…
Q: A artide in the ACI Materials Joumal (vol. 4, 1987. pp. 213-216) describes several experiments…
A:
Q: A soft drink manufacturer wants to determine the proportion of its soda cans that meet quality…
A: Parameter: Any statistical measure based on all the units in the population is called a Parameter.
Q: The article "Modeling of Urban Area Stop-and-Go Traffic Noise" (P. Pamanikabud and C.…
A: Hypotheses and level of significance: Denote μ1 and μ2 as the mean noise level between acceleration…
Q: In an article in IEEE Transactions on Instrumentation and Measurement (2001, Vol. 50, pp. 986-990),…
A: Given that Supply Voltage(v) Current without Electronic(mA) 0.66 7.32 1.32 12.22 1.98 16.34…
Q: The haemoglobin level in g/dL for 14 pregnant women in Basra Maternity Teaching Hospital for the…
A: For the central location and dispersion here we calculate the mean and standard deviation. Mean: The…
Q: An artičle in the ACT Materials Journal (Vol. 84, 1987, pp. 213-216) describes several experiments…
A:
Q: The following data are the numbers of cycles to failure of aluminum test coupons subjected epeated…
A: Given:
Q: 03. In a certain type of metal test specimen, the normal stress on a specimen is Kded to be…
A: Enter the given data into the Excel and MINITAB as follows:
Q: Cell Phone Radiation Listed below are the measured radiation absorption rates (in W/kg)…
A: For the given data construct boxplot and identify the five number summary.Software…
Q: 3.24 An article in the ACI Materials Journal (Vol. 84, 1987, pp. 213–216) describes several…
A: Rodding Level 10 15 20 25 1530 1610 1560 1500 1530 1650 1730 1490 1440 1500 1530…
Q: Based on the data shown below, calculate the regression line (each value to at least two decimal…
A: Enter the given data into the excel as follows:
Q: A repeatability test on a vortex flowmeter yielded the following 35 values of frequency…
A: We can do such Calculation and create such graph in excel easily for a long data set. To create…
Q: temperatures (°C) reported were as follows: 23.01, 22.22, 22.04, 22.62, and 22.59. Test that the…
A: Given that Five samples of the material were tested in a structure, and the average interior…
Q: Calculate C.I, Sample Skewness and Sample Kurtosis from the following grouped data: Class 5-15 15-25…
A:
Q: The following data show the height h, in inches, and weight w, in pounds, of an average adult male.…
A: Let the power model for weight versus height be; w=ahbBy applying logarithm we can transfrom the…
Q: The Turbine Oil Oxidation Test (TOST) and the Rotating Bomb Oxidation Test (RBOT) are two different…
A: From given data, X Y X*Y X*X Y*Y 4200 370 1554000 17640000 136900 3600 340 1224000 12960000…
Q: Here is the dataset containing plant growth measurements, e of plants grown in solutions of…
A: Given information: Distilled H2O Petro NACl MgCl NaCl + MgCl 20 19.84 20 19.88 19.93 19.95…
Q: An article in the ACI Materials Journal (Vol. 84, 1987, pp. 213-216) describes several experiments…
A:
Q: Before microwave ovens are sold, the manufacturer must check to ensure that the radiation coming…
A: a) Using the given data take the values of 1 to 25 from x axis , values of 1 to 20 on y-axis and…
Q: An article in the ACI Materials Journal (Vol. 84, 1987, pp. 213-216) describes several experiments…
A: There are 4 independent samples which follows normal distribution. We have to test whether there is…
Q: 9. The data below are the compressive strength (in psi) of 80 aluminum-lithium alloy specimens. 105…
A: Mean is the average of all the observations and it include all the observation hence there exist no…
Q: Question 3 An artide in the Journal of Agricultural Engineering Research (vol. 52, 1992, pp. 53-76)…
A:
Q: Consider the following Al ible. Source S d.f. MS V.R. 2.824 115.7527 14.0714 Treatments 231.5054…
A: a) From the given output, The design was two way ANOVA, since the source of variation is given by…
Q: The following data were obtained with a cascade impactor: D, (um) G (%) 0.5 5.4 1.0 14.4 23.4 37.0…
A: Develop the plot of “Cumulative % less than the top size vs. top value in the size range or Dp” on…
Q: Is it possible to estimate the following specification? Justify your answer. C=a,+ a‚Y+ a‚F+ a;M+e…
A: The data regarding model 2 given is as follows Consumption Constant 0.6587 Y 0.5442…
Q: The table below shows (lifetime) peptic ulcer rates (per 100 population), U , for various family…
A: Given that : X Y X \cdot YX⋅Y X^2X2 Y^2Y2 4000 14.2 56800 16000000 201.64 6000 13.7…
Q: The article "Bone Density and Insertion Torque as Predictors of Anterior Cruciate Ligament Graft…
A: Given data: Torque (y) 1.8 2.2 1.9 1.3 2.1 2.2 1.6 2.1 1.2 1.8 2.6 2.5 2.5 1.7 1.6 Load (x) 491…
Q: Find a value for the product moment correlation coefficient r for this data Explain what the…
A: here given, formulae: product moment correlation coefficient r=SxySxxSyy Sxy=∑(xi-x )(yi-y )…
Q: The Turbine Oil Oxidation Test (TOST) and the Rotating Bomb Oxidation Test (RBOT) are two different…
A: Since you have posted a question with multiple sub-parts, we will solve first three subparts for…
Q: 1. In a certain type of metal test specimen, the normal stress on a specimen is known to be…
A: Given :
Q: regression model involving 30 observations, the following estimated regression equation was…
A: Given that The regression equation was obtained.ŷ = 170 + 34x1 – 3x2 + 8x3 + 58x4 + 3x5 SSR = 1740…
Q: A sample of 100 dry battery cells tested to find the length of life produced the tollowing results :…
A:
Q: The following table shows the typical depth (rounded to the nearest foot) for nonfailed wells in…
A:
Q: An article in the Journal of Environmental Engineering (1989, Vol. 115(3), reported the results of a…
A:
Q: An article in the ACI Materials Journal (Vol. 84, 1987, pp. 213-216) describes several experiments…
A: Given :
Q: The following data represent the results from the specific gravity test performed in a soil…
A: This is a grouped frequency data, we can calculate the RMS using the class mark.
Q: A dry gas reservoir has produced as follows: Data Static Res. Pressure Cumulative production MM SCF…
A: Production data for a dry reservoir as follows :- Date Cumulative Production MMSCF Static Res,…
Q: Calculate the Karl Pearson's coefficient of skewness from owing data : Size : 1 2 3 4 5 7 Frequency…
A: Given: Size Frequency 1 10 2 18 3 30 4 25 5 12 6 3 7 2
Q: n Applied Life Data Analysis (Wiley, 1982), Wayne Nelson presents the breakdown time of an…
A: Given: The sample values are 0.19, 0.78, 0.96, 1.31, 2.78, 3.16, 4.15, 4.67, 4.85, 6.50, 7.35, 8.01,…
Q: The determination of the shear strength of spot welds is relatively difficult, whereas measuring the…
A: By using the MS-Excel, perform the linear regression using the following steps: Enter the "Shear…
Q: An article in the ACI Materials Journal (Vol. 84, 1987, pp. 213-216) describes several experiments…
A:
Q: A repeatability test on a vortex flowmeter yielded the following 35 values of frequency…
A: Since you have posted a question with multiple subparts, we will solve first three subparts for you.…
Q: (a) Find the equation of the regression line. Ulcer rate, U(x)= . (b) Estimate the peptic ulcer…
A:
Q: How much noisier are streets where cars travel faster? The article "Modeling of Urban Area…
A: Note:- As per our policy, we answer only 3 sub-parts at a time. Please make a new request for the…
Q: The data in Table Q4 shows the results of the analysis on the effect of compressive strength to the…
A: Solution: The independent variable is Compressive strenth. The dependent variable is Density.
Please help me with my homework, pls show solution thanks
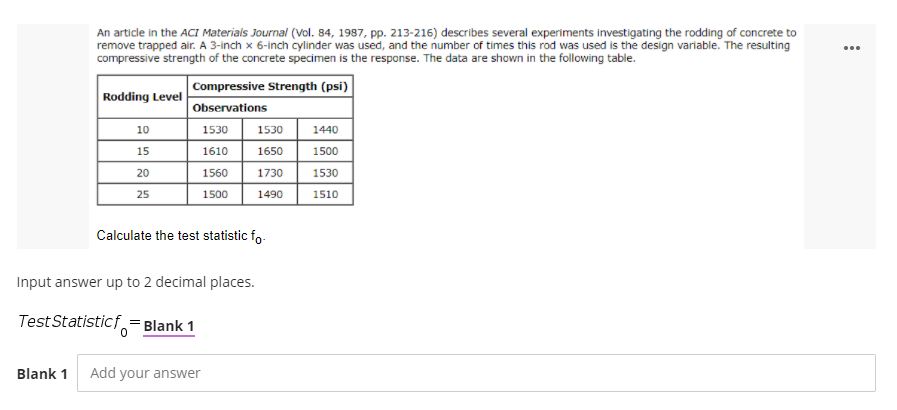
Step by step
Solved in 2 steps
- An article in the ACI Materials Journal (Vol. 84, 1987, pp. 213-216) describes several experiments investigating the rodding of concrete to remove trapped air. A 3-inch x 6-inch cylinder was used, and the number of times this rod was used is the design variable. The resulting compressive strength of the concrete specimen is the response. The data are shown in the following table. ... Compressive Strength (psi) Rodding Level Observations 10 1530 1530 1440 15 1610 1650 1500 20 1560 1730 1530 25 1500 1490 1510 Calculate the test statistic fo- Input answer up to 2 decimal places. TestStatisticf. Blank 1An article in the ACI Materials Journal (Vol. 84, 1987, pp. 213-216) describes several experiments investigating the rodding of concrete to remove trapped air. A 3-inch x 6-inch cylinder was used, and the number of times this rod was used is the design variable. The resulting compressive strength of the concrete specimen is the response. The data are shown in the following table. Compressive Strength (psi) Rodding Level Observations 10 1530 1530 1440 15 1610 1650 1500 20 1560 1730 1530 25 1500 1490 1510 Calculate the test statistic fo- Input answer up to 2 decimal places. Test Statisticf = Blank 1An article in the Fire Safety Journal (“The Effect of Nozzle Design on the Stability and Performance of Turbulent Water Jets,” Vol. 4, August 1981) describes an experiment in which a shape factor was determined for several different nozzle designs at six levels of jet efflux velocity. Interest focused on potential differences between nozzle designs (blocks), with velocity considered as a nuisance variable. The data are shown below: Jet Efflux Velocity (m/s) Nozzle Design 11.73 14.37 16.59 20.43 23.46 28.74 1 0.78 0.80 0.81 0.75 0.77 0.78 2 0.85 0.85 0.92 0.86 0.81 0.83 3 0.93 0.92 0.95 0.89 0.89 0.83 4 1.14 0.97 0.98 0.88 0.86 0.83 5 0.97 0.86 0.78 0.76 0.76 0.75 1) Write the null hypothesis and the alternative hypothesis (for the factor). 2) Find the ANOVA table. (round to five decimal places). 3) What is your decision about the null hypothesis, consider ?. 4) If your decision in part (4) was reject , perform Tukey test to determine which pairwise means are…
- An article in the ACI Materials Journal (Vol. 84, 1987, pp. 213-216) describes several experiments investigating the rodding of concrete to remove trapped air. A 3-inch x 6-inch cylinder was used, and the number of times this rod was used is the design variable. The resulting compressive strength of the concrete specimen is the response. The data are shown in the following table. Compressive Strength (psi) Rodding Level Observations 10 1530 1530 1440 15 1610 1650 1500 20 1560 1730 1530 25 1500 1490 1510 Calculate the test statistic fo-The spotted lanternfly, Lycorma delicatula, is an invasive species to the United States that has the potential to do significant agricultural damage. An ecologist is studying the relationship between the size of the female spotted lanternflies and the number of eggs they produce. The data are summarized below. Length of insect: AVG = 1 inch, SD = 0.15 inchNumber of eggs: AVG = 40 eggs, SD = 5 eggsr = 0.2 Using regression, we can say that the average number of eggs produced by female spotted lanternflies who are 1.1 inch long is closest to... Group of answer choices 42 39 40 41An article in the ACI Materials Journal (Vol. 84, 1987, pp. 213-216) describes several experiments investigating the rodding of concrete to remove trapped air. A 3-inch x 6-inch cylinder was used, and the number of times this rod was used is the design variable. The resulting compressive strength of the concrete specimen is the response. The data are shown in the following table. Compressive Strength (psi) Observations Rodding Level 10 15 20 25 1530 1530 1440 1610 1650 1500 1560 1730 1530 1500 1490 1510 (a) Is there any difference in compressive strength due to the rodding level? Use a = 0.05. Calculate to 2 decimal places for Is there statistical evidence to say that rodding level affects compressive strength? (b) Find to 2 decimal places the P-value for the F-statistic computed in part (a). P-value= (c) Analyze the following residual plots to determine model adequacy, Does the assumption of normality seem reasonable? Does there appear to be an outlier in the data? Does the assumption…
- An experiment was conducted to study the extrusion process of biodegradable packaging foam. Two of the factors considered for their effect on the unit density (mg/ml) were the die temperature (145 °C vs. 155 °C) and the die diameter (3 mm vs. 4 mm). The results are stored in [Packaging Foam 1]. Source: Data extracted from W. Y. Koh, K. M. Eskridge, and M. A. Hanna, "Supersaturated Split-Plot Designs," Journal of Quality Technology, 45, January 2013, pp. 61-72.At the 0.05 level of significance, 3mm 4mm 57.22 145 72.54 145 53.60 66.70 145 48.13 49.28 145 69.89 44.14 145 62.78 58.37 145 55.18 53.98 155 57.50 63.03 155 54.17 46.73 155 73.86 60.17 155 90.28 46.78 155 88.19 43.27 155 82.61 56.93 Die Temperature a. is there an interaction between die temperature and die diameter? b. is there an effect due to die temperature? c. is there an effect due to die diameter? d. Plot the mean unit density for each die temperature for each die diameter. e. What can you conclude about the effect of die…The table below shows the results from the specific gravity (S.G.) test performed in a soil laboratory including twenty samples of sand. Determine the Coefficient of Quartile Variation.Flexural strength is a measure of a material's ability to resist failure in bending. The accompanying data are on flexural strength of concrete (in MegaPascal): (a) Construct a stem-and-leaf display of the data. (Enter numbers from smallest to largest separated by spaces. Enter NONE for stems with no values.) Stems Leaves 5 6 7 8 9 10 11 5.9 7.2 7.3 6.1 8.1 6.8 7.0 7.6 6.8 6.5 7.0 6.3 7.9 9.0 8.2 8.7 7.8 9.7 7.4 7.7 9.7 7.8 7.7 11.6 11.2 11.8 10.7 What appears to be the typical value (center) of the data set? MPa What is the extent of the spread around the typical value? O All of the data values are around the typical value in which the value of the range is around 2 - 3. O The data values are spread out in which the value of the range is around 5 - 6. (b) Does the display appear to be reasonably symmetric about a representative value, or would you describe its shape in some other way? O reasonably symmetric O positive skewness O negative skewness (c) Do there appear to be any outlying…
- Q4 The data in Table Q4 shows the results of the analysis on the effect of compressive strength to the grain on the resin-adjusted density for specimens of radiata pine. Table Q4: Effect of compressive strength Compressive 3224 2587 3785 3520 3083 2711 2241 1640 2081 1852 strength Density 31.2 26.6 | 35.8 | 33.7 31.2 30.8 26.4 18.5 23.1 21.7 (a) Sketch a scatter plot of the data. Then, interpret the relationship between the variables.A study is made of the effect of curing temperature on the compressive strength of a certain type of concrete. Five concrete specimens are cured at each of four temperatures, and the compressive strength of each specimen is measured (in MPa). The results are as follows: Temperature (°C) Strengths 31.2 29.6 30.8 30.0 31.4 10 30.0 27.7 31.1 31.3 30.6 20 35.9 36.8 35.0 34.6 36.5 30 38.3 37.0 37.5 36.1 38.4 Construct an ANOVA table. You may give a range for the P-value. Can you conclude that the mean strength differs with temperature? a. b.A study of the properties of metal plate-connected trusses used for roof support yielded the following observations on axial stiffness index (kips/in.) for plate lengths 4, 6, 8, 10, and 12 in: 4: 315.2 409.5 311.0 326.5 316.8 349.8 309.7 6: 405.1 347.2 361.0 404.5 331.0 348.9 381.7 8: 399.4 366.2 351.0 357.1 409.9 367.3 382.0 10: 353.7 452.9 461.4 433.1 410.6 384.2 362.6 12: 417.4 441.8 419.9 410.7 473.4 441.2 465.8 n USE SALT Does variation in plate length have any effect on true average axial stiffness? State the relevant hypotheses using analysis of variance. O Ho: H1# H2 # Hz# H4# H5 H: at least two µ's are equal O Ho: H1 = H2 = H3= H4= H5 H: at least two u's are unequal O Ho: H1 # H2 # Hz# H4# Hs H: all five u's are equal O Ho: H1 = H2 = Hz3 = H4= Hs H: all five u,'s are unequal Test the relevant hypotheses using analysis of variance with a = 0.01. Display your results in an ANOVA table. (Round your answers to two decimal places.) Degrees of freedom Sum of Squares Mean Source…