
MATLAB: An Introduction with Applications
6th Edition
ISBN: 9781119256830
Author: Amos Gilat
Publisher: John Wiley & Sons Inc
expand_more
expand_more
format_list_bulleted
Related questions
Question
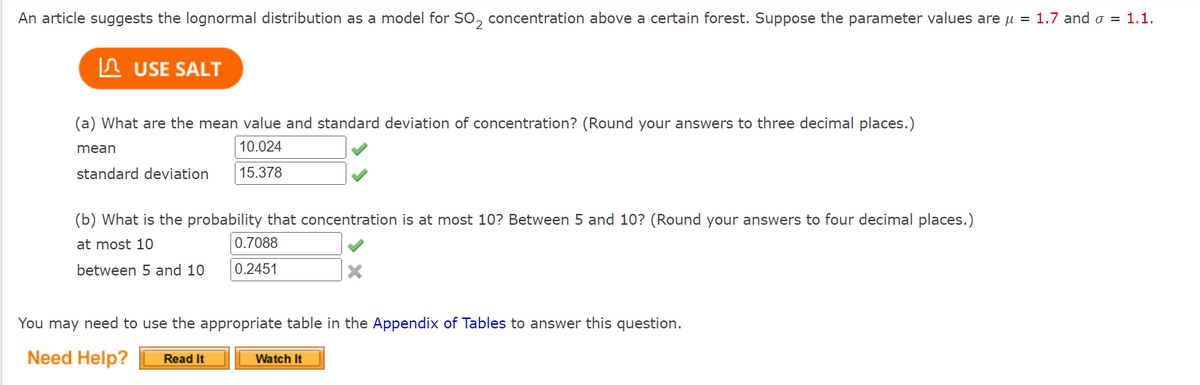

Transcribed Image Text:An article suggests the lognormal distribution as a model for SO₂ concentration above a certain forest. Suppose the parameter values are μ = 1.7 and o = 1.1.
USE SALT
(a) What are the mean value and standard deviation of concentration? (Round your answers to three decimal places.)
mean
10.024
standard deviation
15.378
(b) What is the probability that concentration is at most 10? Between 5 and 10? (Round your answers to four decimal places.)
at most 10
between 5 and 10
0.7088
0.2451
Read It
You may need to use the appropriate table in the Appendix of Tables to answer this question.
Need Help?
X
Watch It
Expert Solution
This question has been solved!
Explore an expertly crafted, step-by-step solution for a thorough understanding of key concepts.

Step by stepSolved in 4 steps with 16 images

Knowledge Booster

Similar questions
- Beetles' weight has a normal distribution with mean of 85g and standard deviation of 6.4g. Suppose we repeatedly took random samples of 12 of these beetles. The percentage of samples that have a sample mean weight less than 83.2g is closest to: (You should use the empirical rules to estimate this percentage) A: 2.5% B: 85% C: 100% D: 15%arrow_forwardOn an exam with µ = 52, a person has a score of X = 44. Which value for the standard deviation would give this person the highest position in the class distribution? Group of answer choices σ = 2 σ = 4 σ = 8 This is impossible to determine based on the information provided..arrow_forwardDon't know how to solvearrow_forward
- Help me plzzarrow_forwardAn article suggests the lognormal distribution as a model for SO2 concentration above a certain forest. Suppose the parameter values are alpha = 1.7 and beta = 0.8. (a) What are the mean value and standard deviation of concentration? (Round your answers to three decimal places.) mean standard deviation (b) What is the probability that concentration is at most 10? Between 5 and 10? (Round your answers to four decimal places.) at most 10 between 5 and 10arrow_forward
arrow_back_ios
arrow_forward_ios
Recommended textbooks for you
- MATLAB: An Introduction with ApplicationsStatisticsISBN:9781119256830Author:Amos GilatPublisher:John Wiley & Sons Inc
 Probability and Statistics for Engineering and th...StatisticsISBN:9781305251809Author:Jay L. DevorePublisher:Cengage Learning
 Statistics for The Behavioral Sciences (MindTap C...StatisticsISBN:9781305504912Author:Frederick J Gravetter, Larry B. WallnauPublisher:Cengage Learning
  Elementary Statistics: Picturing the World (7th E...StatisticsISBN:9780134683416Author:Ron Larson, Betsy FarberPublisher:PEARSON
 The Basic Practice of StatisticsStatisticsISBN:9781319042578Author:David S. Moore, William I. Notz, Michael A. FlignerPublisher:W. H. Freeman
 Introduction to the Practice of StatisticsStatisticsISBN:9781319013387Author:David S. Moore, George P. McCabe, Bruce A. CraigPublisher:W. H. Freeman
MATLAB: An Introduction with Applications
Statistics
ISBN:9781119256830
Author:Amos Gilat
Publisher:John Wiley & Sons Inc
Probability and Statistics for Engineering and th...
Statistics
ISBN:9781305251809
Author:Jay L. Devore
Publisher:Cengage Learning
Statistics for The Behavioral Sciences (MindTap C...
Statistics
ISBN:9781305504912
Author:Frederick J Gravetter, Larry B. Wallnau
Publisher:Cengage Learning
Elementary Statistics: Picturing the World (7th E...
Statistics
ISBN:9780134683416
Author:Ron Larson, Betsy Farber
Publisher:PEARSON
The Basic Practice of Statistics
Statistics
ISBN:9781319042578
Author:David S. Moore, William I. Notz, Michael A. Fligner
Publisher:W. H. Freeman
Introduction to the Practice of Statistics
Statistics
ISBN:9781319013387
Author:David S. Moore, George P. McCabe, Bruce A. Craig
Publisher:W. H. Freeman