
MATLAB: An Introduction with Applications
6th Edition
ISBN: 9781119256830
Author: Amos Gilat
Publisher: John Wiley & Sons Inc
expand_more
expand_more
format_list_bulleted
Related questions
Question
thumb_up100%
Can someone please explain it to me ASAP???!!!
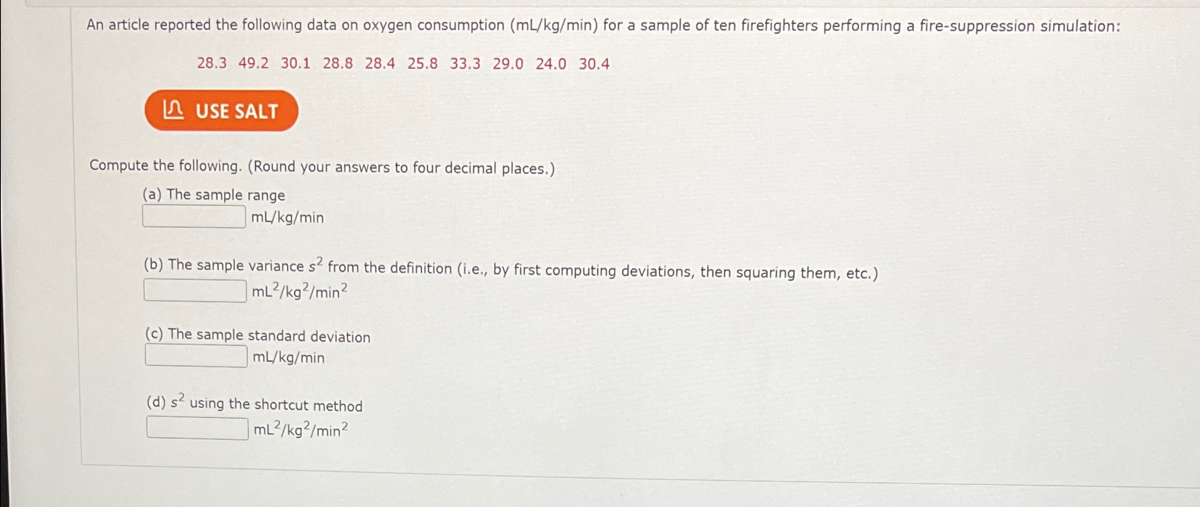

Transcribed Image Text:An article reported the following data on oxygen consumption (mL/kg/min) for a sample of ten firefighters performing a fire-suppression simulation:
28.3 49.2 30.1 28.8 28.4 25.8 33.3 29.0 24.0 30.4
A USE SALT
Compute the following. (Round your answers to four decimal places.)
(a) The sample range
mL/kg/min
(b) The sample variance s2 from the definition (i.e., by first computing deviations, then squaring them, etc.)
mL2/kg?/min?
(c) The sample standard deviation
mL/kg/min
(d) s using the shortcut method
mL2/kg?/min?
Expert Solution
arrow_forward
Step 1
We know that
First Arrange data in ascending order.
24.0, 25.8, 28.3, 28.4, 28.8, 29.0, 30.1, 30.4, 33.3, 49.2
Range = maximum - minimum
NOTE:- According to bartleby guidelines expert can solve maximum three subparts of a question and rest can be reposted please
| x | x2 |
| 28.3 | 800.89 |
| 49.2 | 2420.64 |
| 30.1 | 906.01 |
| 28.8 | 829.44 |
| 28.4 | 806.56 |
| 25.8 | 665.64 |
| 33.3 | 1108.89 |
| 29 | 841 |
| 24 | 576 |
| 30.4 | 924.16 |
| ∑x=307.3 | ∑x2=9879.23 |

Step by stepSolved in 2 steps with 1 images

Knowledge Booster

Similar questions
- How to do question 22, 26, and 28?arrow_forwardCan you explain further the breakdown for part c please?arrow_forwardA marketing firm wishes to test the effectiveness of the audio/visual presentation of certain information as opposed to the purely audio presentation of the information. To this end 100 volunteers were given a 10 minute presentation in which the information was presented in an audio/visual format. A second group of 100 volunteers was presented the same information in a purely audio format. Each person in each of the two groups was asked the same 20 questions related to the information in the presentation. The audio/visual group had an average of 10.5 correct responses with a sample standard deviation of 4. The purely audio group had an average of 9.4 correct responses with a standard deviation of 3. The marketing firm believes this means that the audio/visual format leads to better retention of the information. We test the hypotheses H0: 1 -2=0 versus Ha: 1 -2>0 at a 2% level of significance. Here denotes 1 the population average number of correct responses for…arrow_forward
- Suppose your school has 1000 students. Why can you be pretty sure that some pair of them will have telephone numbers that end in the same two digits and that they will like the same brand of soda?arrow_forwardOC. Ay 450- 400- 350- 300- 250- 200- 150- 100-arrow_forwardIs there any way I can get this written by hand? It's hard to read, but I'm attempting to grasp it.arrow_forward
- what is the final answer to this questionarrow_forwardThe past records of a supermarket show that its customers spend an average of $110 per visit at this store. Recently the management of the store initiated a promotional campaign according to which each customer receives points based on the total money spent at the store, and these points can be used to buy products at the store. The management expects that as a result of this campaign, the customers should be encouraged to spend more money at the store. To check whether this is true, the manager of the store took a sample of 14 customers who visited the store. The following data give the money (in dollars) spent by these customers at this supermarket during their visits. 106.13 107.43 124.68 124.88 101.17 72.75 85.45 86.05 100.4 98.84 101.63 95.56 89.40 119.52 Assume that the money spent by all customers at this supermarket has a normal distribution. Using a 2.5% significance level, can you conclude that the mean amount of money spent by all customers at this supermarket after the…arrow_forwardDuring his short stint as Shadow Finance Minister, Barnaby Joyce displayed a curious grasp of numbers. One of his most infamous exclamations was “All this billions, quillions, Brazilians.” Less well known was his tax-reform proposal, recommending that if you earn $x per day, you are taxed x% of that amount (with the understanding that you pay 100% tax if you earn $100 or more per day. Under Senator Barnaby’s plan, which amount x gives you the highest earnings after tax has been taken out?arrow_forward
arrow_back_ios
arrow_forward_ios
Recommended textbooks for you
- MATLAB: An Introduction with ApplicationsStatisticsISBN:9781119256830Author:Amos GilatPublisher:John Wiley & Sons Inc
 Probability and Statistics for Engineering and th...StatisticsISBN:9781305251809Author:Jay L. DevorePublisher:Cengage Learning
 Statistics for The Behavioral Sciences (MindTap C...StatisticsISBN:9781305504912Author:Frederick J Gravetter, Larry B. WallnauPublisher:Cengage Learning
  Elementary Statistics: Picturing the World (7th E...StatisticsISBN:9780134683416Author:Ron Larson, Betsy FarberPublisher:PEARSON
 The Basic Practice of StatisticsStatisticsISBN:9781319042578Author:David S. Moore, William I. Notz, Michael A. FlignerPublisher:W. H. Freeman
 Introduction to the Practice of StatisticsStatisticsISBN:9781319013387Author:David S. Moore, George P. McCabe, Bruce A. CraigPublisher:W. H. Freeman
MATLAB: An Introduction with Applications
Statistics
ISBN:9781119256830
Author:Amos Gilat
Publisher:John Wiley & Sons Inc
Probability and Statistics for Engineering and th...
Statistics
ISBN:9781305251809
Author:Jay L. Devore
Publisher:Cengage Learning
Statistics for The Behavioral Sciences (MindTap C...
Statistics
ISBN:9781305504912
Author:Frederick J Gravetter, Larry B. Wallnau
Publisher:Cengage Learning
Elementary Statistics: Picturing the World (7th E...
Statistics
ISBN:9780134683416
Author:Ron Larson, Betsy Farber
Publisher:PEARSON
The Basic Practice of Statistics
Statistics
ISBN:9781319042578
Author:David S. Moore, William I. Notz, Michael A. Fligner
Publisher:W. H. Freeman
Introduction to the Practice of Statistics
Statistics
ISBN:9781319013387
Author:David S. Moore, George P. McCabe, Bruce A. Craig
Publisher:W. H. Freeman