
MATLAB: An Introduction with Applications
6th Edition
ISBN: 9781119256830
Author: Amos Gilat
Publisher: John Wiley & Sons Inc
expand_more
expand_more
format_list_bulleted
Related questions
Question
An article regarding interracial dating and marriage recently appeared in a newspaper. Of the 1708 randomly selected adults, 314 identified themselves as Latinos, 322 identified themselves as blacks, 253 identified themselves as Asians, and 775 identified themselves as whites. Among Asians, 79% would welcome a white person into their families, 71% would welcome a Latino, and 66% would welcome a black person.
NOTE: If you are using a Student's t-distribution, you may assume that the underlying population is
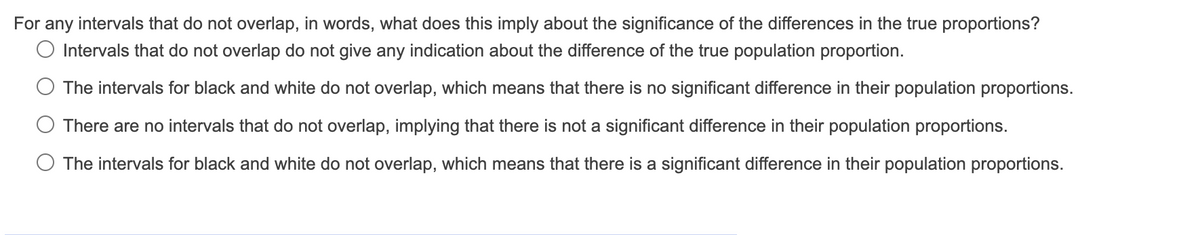

Transcribed Image Text:For any intervals that do not overlap, in words, what does this imply about the significance of the differences in the true proportions?
Intervals that do not overlap do not give any indication about the difference of the true population proportion.
The intervals for black and white do not overlap, which means that there is no significant difference in their population proportions.
There are no intervals that do not overlap, implying that there is not a significant difference in their population proportions.
O The intervals for black and white do not overlap, which means that there is a significant difference in their population proportions.

Transcribed Image Text:O Part (a)
Construct the 95% confidence intervals for the three Asian responses. (Round your answers to four decimal places.)
welcome a white person
welcome a Latino
welcome a black person
O Part (b)
Even though the three point estimates are different, do any of the confidence intervals overlap? Which? (Select all that apply.)
No confidence intervals overlap.
Yes, the intervals for Latinos and blacks overlap.
Yes, the intervals for whites and blacks overlap.
Yes, the intervals for whites and Latinos overlap.
Yes, all three intervals overlap.
O Part (c)
For any intervals that do overlap, in words, what does this imply about the significance of the differences in the true proportions?
O The confidence intervals for black and Latino overlap, and the overlapping region contains the black and Latino sample proportions; therefore, there is no evidence of a significant difference between their true proportions.
The confidence intervals for white and Latino overlap, but the overlapping region does not contain the white or Latino sample proportions; therefore, there is evidence of a significant difference between their true proportions.
The confidence intervals for white and Latino overlap, as do those for black and Latino, which means that there is no significant difference in their proportions.
There are no confidence intervals that overlap, implying that there is a significant difference in their population proportions.
Intervals that overlap do not give any indication about the difference of the true population proportion.
Expert Solution
This question has been solved!
Explore an expertly crafted, step-by-step solution for a thorough understanding of key concepts.

This is a popular solution

Trending nowThis is a popular solution!

Step by stepSolved in 2 steps with 1 images

Knowledge Booster

Similar questions
- The city of Raleigh has 10200 registered voters. There are two candidates for city council in an upcoming election: Brown and Feliz. The day before the election, a telephone poll of 400 randomly selected registered voters was conducted. 197 said they'd vote for Brown, 176 said they'd vote for Feliz, and 27 were undecided.Give the sample statistic for the proportion of voters surveyed who said they'd vote for Brown. Note: The proportion should be a fraction or decimal, not a percent.197400 This sample statistic suggests that we might expect of the 10200 registered voters to vote for Brown.arrow_forward9arrow_forwardAn article regarding interracial dating and marriage recently appeared in a newspaper. Of the 1715 randomly selected adults, 304 identified themselves as Latinos, 324 identified themselves as blacks, 255 identified themselves as Asians, and 777 identified themselves as whites. Among Asians, 79% would welcome a white person into their families, 71% would welcome a Latino, and 66% would welcome a black person.NOTE: If you are using a Student's t-distribution, you may assume that the underlying population is normally distributed. (In general, you must first prove that assumption, though.) Construct the 95% confidence intervals for the three Asian responses. (Round your answers to four decimal places.) welcome a white person , welcome a Latino , welcome a black personarrow_forward
- A consumer survey was conducted to examine patterns in ownership of tablet computers, cellular telephones, and Blu-ray players. The following data were obtained: 311 people had tablet computers, 236 had cell phones, 265 had Blu-ray players, 65 had all three, 62 had none, 92 had cell phones and Blu-ray players, 57 had cell phones but no computers or Blu-ray players, and 108 had computers and Blu-ray players but no cell phones. (Round your answers to one decimal place.) A) What percent of people surveyed owned a cell phone? B) What percent of the people surveyed owned only a cell phone?arrow_forwardA consumer survey was conducted to examine patterns in ownership of tablet computers, cellular telephones, and Blu-ray players. The following data were obtained: 315 people had tablet computers, 236 had cell phones, 265 had Blu-ray players, 69 had all three, 64 had none, 94 had cell phones and Blu-ray players, 55 had cell phones but no computers or Blu-ray players, and 104 had computers and Blu-ray players but no cell phones. (Round your answers to one decimal place.) (a) What percent of the people surveyed owned a cell phone? % (b) What percent of the people surveyed owned only a cell phone? %arrow_forwardThe city of Raleigh has 10500 registered voters. There are two candidates for city council in an upcoming election: Brown and Feliz. The day before the election, a telephone poll of 500 randomly selected registered voters was conducted. 158 said they'd vote for Brown, 293 said they'd vote for Feliz, and 49 were undecided.Give the sample statistic for the proportion of voters surveyed who said they'd vote for Brown. Note: The proportion should be a fraction or decimal, not a percent.arrow_forward
arrow_back_ios
arrow_forward_ios
Recommended textbooks for you
- MATLAB: An Introduction with ApplicationsStatisticsISBN:9781119256830Author:Amos GilatPublisher:John Wiley & Sons Inc
 Probability and Statistics for Engineering and th...StatisticsISBN:9781305251809Author:Jay L. DevorePublisher:Cengage Learning
 Statistics for The Behavioral Sciences (MindTap C...StatisticsISBN:9781305504912Author:Frederick J Gravetter, Larry B. WallnauPublisher:Cengage Learning
  Elementary Statistics: Picturing the World (7th E...StatisticsISBN:9780134683416Author:Ron Larson, Betsy FarberPublisher:PEARSON
 The Basic Practice of StatisticsStatisticsISBN:9781319042578Author:David S. Moore, William I. Notz, Michael A. FlignerPublisher:W. H. Freeman
 Introduction to the Practice of StatisticsStatisticsISBN:9781319013387Author:David S. Moore, George P. McCabe, Bruce A. CraigPublisher:W. H. Freeman
MATLAB: An Introduction with Applications
Statistics
ISBN:9781119256830
Author:Amos Gilat
Publisher:John Wiley & Sons Inc
Probability and Statistics for Engineering and th...
Statistics
ISBN:9781305251809
Author:Jay L. Devore
Publisher:Cengage Learning
Statistics for The Behavioral Sciences (MindTap C...
Statistics
ISBN:9781305504912
Author:Frederick J Gravetter, Larry B. Wallnau
Publisher:Cengage Learning
Elementary Statistics: Picturing the World (7th E...
Statistics
ISBN:9780134683416
Author:Ron Larson, Betsy Farber
Publisher:PEARSON
The Basic Practice of Statistics
Statistics
ISBN:9781319042578
Author:David S. Moore, William I. Notz, Michael A. Fligner
Publisher:W. H. Freeman
Introduction to the Practice of Statistics
Statistics
ISBN:9781319013387
Author:David S. Moore, George P. McCabe, Bruce A. Craig
Publisher:W. H. Freeman