MATLAB: An Introduction with Applications
6th Edition
ISBN: 9781119256830
Author: Amos Gilat
Publisher: John Wiley & Sons Inc
expand_more
expand_more
format_list_bulleted
Question
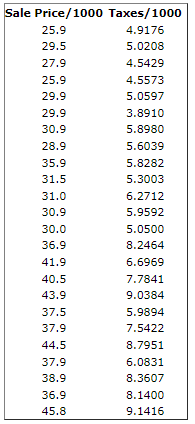
An article in Technometrics by S. C. Narula and J. F. Wellington (“Prediction, Linear Regression, and a Minimum Sum of Relative Errors,” Vol. 19, 1977) presents data on the selling price (y) and annual taxes (x) for 24 houses. The taxes include local, school and county taxes. The data are shown in the table below. Calculate the least square estimates of slope and intercept.
Input answers up to 3 decimal places.
Slope = Blank 1
Intercept = Blank 2

Transcribed Image Text:Sale Price/1000 Taxes/1000
25.9
4.9176
29.5
5.0208
27.9
4.5429
25.9
4.5573
29.9
5.0597
29.9
3.8910
30.9
5.8980
28.9
5.6039
35.9
5.8282
31.5
5.3003
31.0
6.2712
30.9
5.9592
30.0
5.0500
36.9
8.2464
41.9
6.6969
40.5
7.7841
43.9
9.0384
37.5
5.9894
37.9
7.5422
44.5
8.7951
37.9
6.0831
38.9
8.3607
36.9
8.1400
45.8
9.1416
Expert Solution
This question has been solved!
Explore an expertly crafted, step-by-step solution for a thorough understanding of key concepts.
This is a popular solution
Trending nowThis is a popular solution!
Step by stepSolved in 3 steps with 1 images

Knowledge Booster
Similar questions
- The table below shows the average weekly wages (in dollars) for state government employees and federal government employees for 10 years. Construct and interpret a 90% prediction interval for the average weekly wages of federal government employees when the average weekly wages of state government employees is $825. The equation of the regression line is y = 1.597x- 169.203. Wages (state), x Wages (federal), y 742 775 783 802 842 890 912 939 949 954 1,002 1,039 1,097 1,145 1,199 1,242 1,271 1,299 1,335 1,398 Construct and interpret a 90% prediction interval for the average weekly wages of federal government employees when the average weekly wages of state government employees is $825. Select the correct choice below and fill in the answer boxes to complete your choice. (Round to the nearest cent as needed.) O A. There is a 90% chance that the predicted average weekly wages of federal government employees is between S and S given a state average weekly wage of $825. O B. We can be 90%…arrow_forwardA national homebuilder builds single-family homes and condominium-style townhouses. The accompanying dataset provides information on the selling price, lot cost, and type of home for closings during one month. Complete parts a through c. E Click the icon to view the house sales data. House sales data a. Develop a multiple regression model for sales price as a function of lot cost and type of home without any interaction term. Create a dummy variable named "Townhouse", where it is equal to 1 when Type = "Townhouse" and 0 otherwise. Determine the coefficients of the regression equation. Туре Townhouse Sales Price Lot Cost Sales Price = 108726 + ( 3.68 )• Lot Cost + ( - 75063 )• Townhouse $114,740 $138,530 $21,700 $26,550 Single Family Townhouse Single Family Townhouse (Round the constant and coefficient of Townhouse to the nearest integer as needed. Round all other values to two decimal places as needed.) $149,905 $172.000 $25,550 $26,200 b. Determine if an interaction exists between lot…arrow_forwardB b. What does the scatter diagram developed in part (a) indicate about the relationship between the two variables? The scatter diagram indicates a positive linear relationship between a = average number of passing yar and y = the percentage of games won by the team. c. Develop the estimated regression equation that could be used to predict the percentage of games won given the avera passing yards per attempt. Enter negative value as negative number. WinPct =| |)(Yds/Att) (to 4 decimals) d. Provide an interpretation for the slope of the estimated regression equation (to 1 decimal). The slope of the estimated regression line is approximately So, for every increase : of one yar number of passes per attempt, the percentage of games won by the team increases by %. e. For the 2011 season, the average number of passing yards per attempt for the Kansas City Chiefs was was 5.5. Use th regression equation developed in part (c) to predict the percentage of games won by the Kansas City Chiefs.…arrow_forward
Recommended textbooks for you
 MATLAB: An Introduction with ApplicationsStatisticsISBN:9781119256830Author:Amos GilatPublisher:John Wiley & Sons Inc
 Probability and Statistics for Engineering and th...StatisticsISBN:9781305251809Author:Jay L. DevorePublisher:Cengage Learning
 Statistics for The Behavioral Sciences (MindTap C...StatisticsISBN:9781305504912Author:Frederick J Gravetter, Larry B. WallnauPublisher:Cengage Learning
 Elementary Statistics: Picturing the World (7th E...StatisticsISBN:9780134683416Author:Ron Larson, Betsy FarberPublisher:PEARSON
 The Basic Practice of StatisticsStatisticsISBN:9781319042578Author:David S. Moore, William I. Notz, Michael A. FlignerPublisher:W. H. Freeman
 Introduction to the Practice of StatisticsStatisticsISBN:9781319013387Author:David S. Moore, George P. McCabe, Bruce A. CraigPublisher:W. H. Freeman

MATLAB: An Introduction with Applications
Statistics
ISBN:9781119256830
Author:Amos Gilat
Publisher:John Wiley & Sons Inc

Probability and Statistics for Engineering and th...
Statistics
ISBN:9781305251809
Author:Jay L. Devore
Publisher:Cengage Learning

Statistics for The Behavioral Sciences (MindTap C...
Statistics
ISBN:9781305504912
Author:Frederick J Gravetter, Larry B. Wallnau
Publisher:Cengage Learning

Elementary Statistics: Picturing the World (7th E...
Statistics
ISBN:9780134683416
Author:Ron Larson, Betsy Farber
Publisher:PEARSON

The Basic Practice of Statistics
Statistics
ISBN:9781319042578
Author:David S. Moore, William I. Notz, Michael A. Fligner
Publisher:W. H. Freeman

Introduction to the Practice of Statistics
Statistics
ISBN:9781319013387
Author:David S. Moore, George P. McCabe, Bruce A. Craig
Publisher:W. H. Freeman