
Structural Analysis
6th Edition
ISBN: 9781337630931
Author: KASSIMALI, Aslam.
Publisher: Cengage,
expand_more
expand_more
format_list_bulleted
Related questions
Question
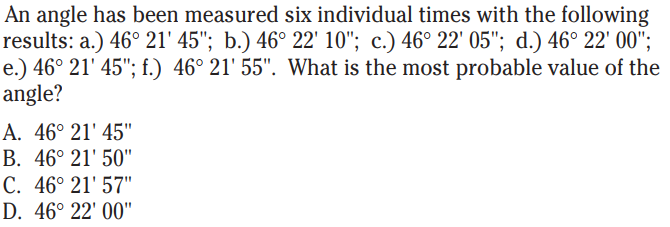

Transcribed Image Text:An angle has been measured six individual times with the following
results: a.) 46° 21' 45"; b.) 46° 22' 10"; c.) 46° 22' 05"; d.) 46° 22' 00";
e.) 46° 21' 45"; f.) 46° 21' 55". What is the most probable value of the
angle?
А. 46° 21' 45"
В. 46° 21' 50"
C. 46° 21' 57"
D. 46° 22' 00"
Expert Solution
This question has been solved!
Explore an expertly crafted, step-by-step solution for a thorough understanding of key concepts.

This is a popular solution

Trending nowThis is a popular solution!

Step by stepSolved in 2 steps with 2 images

Knowledge Booster

Similar questions
- 5. The following data were obtained by stadia observations: Vertical angle = + 9°25', upper and lower stadia hair readings are 2.352 and 0.995 m., respectively. The stadia interval factor is known to be 99.00 and C is 0.381 m. The height of the instrument above the instrument station (point A) is 1.496 and rod reading is taken at 1.589m. Determine the following: the horizontal stadia distance а. b. the vertical stadia distance c. the elevation on the point where the rod was heldarrow_forwardP Give suitable examples as you discuss how errors in surveying activities are classified. The three angles of a triangle were measured using a triangulation scheme, and their mean values were reported as 50° 48′ 18′′, 64° 2036", and 64° 5100".Each of these means has a standard deviation of 4 according to analysis of each set.The angles were measured again at a later time under better lighting, resulting in mean values of 64° 20′ 39", 64° 50' 58", and 50° 48' 20" prime prime Each value's standard deviation was 2 n. Determine the most probable values of the anglesarrow_forwardA level loop was run and the raw elevations in Table 2 were calculated based on backsights and foresights. A plan view of the loop is shown in Figure 2. The true elevation of BM1 is 195.00 ft. Adjust the elevation of each station such that the error is evenly spaced. Show sample calculations of your work. Also determine the accuracy ratio of the survey. BM₁ 5 mi 3 mi BM2 BM4 3 mi BM3 4 mi Figure 2 Table 2 Station Raw Elevation [ft] BM1 195.0 BM2 205.6 BM3 209.8 BM4 204.7 BM1 195.5arrow_forward
Recommended textbooks for you
 Structural Analysis (10th Edition)Civil EngineeringISBN:9780134610672Author:Russell C. HibbelerPublisher:PEARSON
 Principles of Foundation Engineering (MindTap Cou...Civil EngineeringISBN:9781337705028Author:Braja M. Das, Nagaratnam SivakuganPublisher:Cengage Learning
 Fundamentals of Structural AnalysisCivil EngineeringISBN:9780073398006Author:Kenneth M. Leet Emeritus, Chia-Ming Uang, Joel LanningPublisher:McGraw-Hill Education
 Traffic and Highway EngineeringCivil EngineeringISBN:9781305156241Author:Garber, Nicholas J.Publisher:Cengage Learning
Structural Analysis (10th Edition)
Civil Engineering
ISBN:9780134610672
Author:Russell C. Hibbeler
Publisher:PEARSON
Principles of Foundation Engineering (MindTap Cou...
Civil Engineering
ISBN:9781337705028
Author:Braja M. Das, Nagaratnam Sivakugan
Publisher:Cengage Learning
Fundamentals of Structural Analysis
Civil Engineering
ISBN:9780073398006
Author:Kenneth M. Leet Emeritus, Chia-Ming Uang, Joel Lanning
Publisher:McGraw-Hill Education
Traffic and Highway Engineering
Civil Engineering
ISBN:9781305156241
Author:Garber, Nicholas J.
Publisher:Cengage Learning