MATLAB: An Introduction with Applications
6th Edition
ISBN: 9781119256830
Author: Amos Gilat
Publisher: John Wiley & Sons Inc
expand_more
expand_more
format_list_bulleted
Concept explainers
Topic Video
Question
Can I use 8 questions and have all 8 completed, thank you.

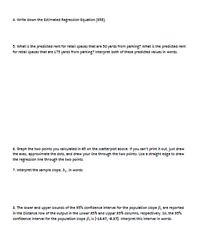
Transcribed Image Text:4. Write down the Estimated Regression Equation (ERE).
5. What is the predicted rent for retail spaces that are 30 yards from parking? What is the predicted rent
for retail spaces that are 175 yards from parking? Interpret both of these predicted values in words.
6. Graph the two points you calculated in a3 on the scatterplot above. If you can't print it out, just draw
the axes, approximate the dots, and draw your line through the two points. Use a straight edge to draw
the regression fine through the two points.
7. Interpret the sample slope, b, in words
8. The lower and upper bounds of the 93% confidence interval for the population silope , are reported
in the Distance row of the output in the Lower 95% and Upper 95% columns, respectively. So, the 93%
confidence interval for the population slope f is (-14.47, -837). Interpret this interval in words.

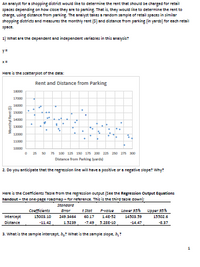
Transcribed Image Text:An analyst for a shopping district would like to determine the rent that should be charged for retail
spaces depending on how close they are to parking That is, they would like to determine the rent to
charge, using distance from parking. The analyst takes a random sample of retail spaces in similar
shopping districts and messures the monthly rent (5) and distance from parking (in yards) for each retail
space
1) what are the dependent and independent variables in this analysis?
y=
Here is the scatterplot of the data:
Rent and Distance from Parking
17000
10000
15000
14000
13000
.B
12000
11000
10000
O 23 so 75 100 125 150 175 200 225 250 275 so0
Distance from Parking lyarda)
2. Do you anticipate that the regression line will have a positive or a negative slope? Why:
Here is the Coefficients Table from the regression output (See the Regression Output Equations
handout - the one-page roadmap-for reference. This is the third table down):
Standard
Coefficients
t Stat
Lower 95%
Upper 95%
Error
P-value
Intercept
15003.10
249.3464
60.17
14E-52
14503.59
15302.6
Distance
-11.42
1.5239
-7.49
5.28E-10
-14.47
-8.37
3. What is the sample intercept, h, What is the sample slope, b,
Monthyl Rent (5)
Expert Solution
This question has been solved!
Explore an expertly crafted, step-by-step solution for a thorough understanding of key concepts.
This is a popular solution
Trending nowThis is a popular solution!
Step by stepSolved in 4 steps

Knowledge Booster
Learn more about
Need a deep-dive on the concept behind this application? Look no further. Learn more about this topic, statistics and related others by exploring similar questions and additional content below.Similar questions
- You have 4 hours of free time today. You want to spend each hour doing something different, and you have 7 hour-long activities to choose from. How many different ways could you schedule your free time today?arrow_forwardThe average of six numbers is 32. The average of the first three is 26. Find the fourth number if the average of the last two is 46.arrow_forwardhow did you came up with 4 please explainarrow_forward
arrow_back_ios
arrow_forward_ios
Recommended textbooks for you
 MATLAB: An Introduction with ApplicationsStatisticsISBN:9781119256830Author:Amos GilatPublisher:John Wiley & Sons Inc
 Probability and Statistics for Engineering and th...StatisticsISBN:9781305251809Author:Jay L. DevorePublisher:Cengage Learning
 Statistics for The Behavioral Sciences (MindTap C...StatisticsISBN:9781305504912Author:Frederick J Gravetter, Larry B. WallnauPublisher:Cengage Learning
 Elementary Statistics: Picturing the World (7th E...StatisticsISBN:9780134683416Author:Ron Larson, Betsy FarberPublisher:PEARSON
 The Basic Practice of StatisticsStatisticsISBN:9781319042578Author:David S. Moore, William I. Notz, Michael A. FlignerPublisher:W. H. Freeman
 Introduction to the Practice of StatisticsStatisticsISBN:9781319013387Author:David S. Moore, George P. McCabe, Bruce A. CraigPublisher:W. H. Freeman

MATLAB: An Introduction with Applications
Statistics
ISBN:9781119256830
Author:Amos Gilat
Publisher:John Wiley & Sons Inc

Probability and Statistics for Engineering and th...
Statistics
ISBN:9781305251809
Author:Jay L. Devore
Publisher:Cengage Learning

Statistics for The Behavioral Sciences (MindTap C...
Statistics
ISBN:9781305504912
Author:Frederick J Gravetter, Larry B. Wallnau
Publisher:Cengage Learning

Elementary Statistics: Picturing the World (7th E...
Statistics
ISBN:9780134683416
Author:Ron Larson, Betsy Farber
Publisher:PEARSON

The Basic Practice of Statistics
Statistics
ISBN:9781319042578
Author:David S. Moore, William I. Notz, Michael A. Fligner
Publisher:W. H. Freeman

Introduction to the Practice of Statistics
Statistics
ISBN:9781319013387
Author:David S. Moore, George P. McCabe, Bruce A. Craig
Publisher:W. H. Freeman