An agriculture publication claims that the population mean of the birth weights for all Suffolk sheep is 4.29 kg. A veterinary service has hired you to test that claim. To do so, you select a random sample of 35 Suffolk sheep and record the birth weights. Assume it is known that the population standard deviation of the birth weights of Suffolk sheep is 2.15 kg. Based on your sample, follow the steps below to construct a 99% confidence interval for the population mean of the birth weights for all Suffolk sheep. Then state whether the confidence interval you construct contradicts the publication's claim. (If necessary, consult a list of formulas.) (a) Click on "Take Sample" to see the results from your random sample of 35 Suffolk sheep. Take Sample Number of sheep 35 Sample mean 5.52 deviation Sample standard Population standard deviation 1.78 2.15 Enter the values of the sample size, the point estimate for the population mean, the population standard deviation, and the critical value you need for your 99% confidence interval. (Choose the correct critical value from the table of critical values provided.) When you are done, select "Compute". Sample size: X (b) Point estimate: Standard error: Critical values Population standard deviation: Margin of error: F0.005 = 2.576 Critical value: Compute 99% confidence interval: F0.010=2.326 0.0251.960 F0.0501.645 F0.100 = 1.282 Based on your sample, graph the 99% confidence interval for the population mean of the birth weights for all Suffolk sheep. . Enter the lower and upper limits on the graph to show your confidence interval. For the point (), enter the publication's claim of 4.29 kg. 0.00 99% confidence interval: 5.00 10.00 . 0.00 2.00 4.00 6.00 8.00 10.00 Español 8民 Submit Assignment

icon
Related questions
Question
An agriculture publication claims that the population mean of the birth weights for all Suffolk sheep is 4.29 kg. A veterinary service has hired you to test that
claim. To do so, you select a random sample of 35 Suffolk sheep and record the birth weights. Assume it is known that the population standard deviation of the
birth weights of Suffolk sheep is 2.15 kg.
Based on your sample, follow the steps below to construct a 99% confidence interval for the population mean of the birth weights for all Suffolk sheep. Then
state whether the confidence interval you construct contradicts the publication's claim. (If necessary, consult a list of formulas.)
(a) Click on "Take Sample" to see the results from your random sample of 35 Suffolk sheep.
Take Sample
Number of sheep
35
Sample mean
5.52
deviation
Sample standard
Population standard
deviation
1.78
2.15
Enter the values of the sample size, the point estimate for the population mean, the population standard deviation, and the critical value you need
for your 99% confidence interval. (Choose the correct critical value from the table of critical values provided.) When you are done, select "Compute".
Sample size:
X
(b)
Point estimate:
Standard error:
Critical values
Population standard deviation:
Margin of error:
F0.005 = 2.576
Critical value:
Compute
99% confidence interval:
F0.010=2.326
0.0251.960
F0.0501.645
F0.100 = 1.282
Based on your sample, graph the 99% confidence interval for the population mean of the birth weights for all Suffolk sheep.
.
Enter the lower and upper limits on the graph to show your confidence interval.
For the point (), enter the publication's claim of 4.29 kg.
0.00
99% confidence interval:
5.00
10.00
.
0.00
2.00
4.00
6.00
8.00
10.00
Español
8民
Submit Assignment
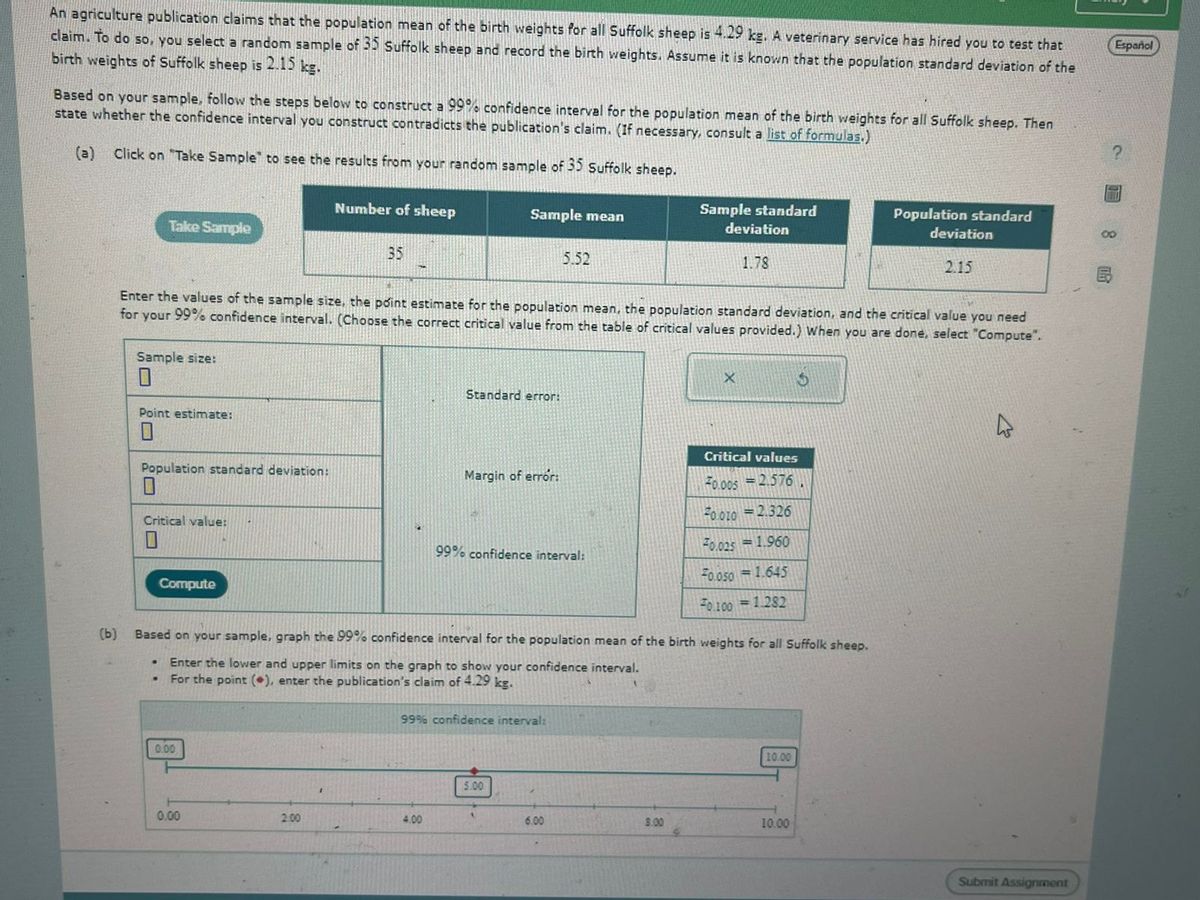
Transcribed Image Text:An agriculture publication claims that the population mean of the birth weights for all Suffolk sheep is 4.29 kg. A veterinary service has hired you to test that claim. To do so, you select a random sample of 35 Suffolk sheep and record the birth weights. Assume it is known that the population standard deviation of the birth weights of Suffolk sheep is 2.15 kg. Based on your sample, follow the steps below to construct a 99% confidence interval for the population mean of the birth weights for all Suffolk sheep. Then state whether the confidence interval you construct contradicts the publication's claim. (If necessary, consult a list of formulas.) (a) Click on "Take Sample" to see the results from your random sample of 35 Suffolk sheep. Take Sample Number of sheep 35 Sample mean 5.52 deviation Sample standard Population standard deviation 1.78 2.15 Enter the values of the sample size, the point estimate for the population mean, the population standard deviation, and the critical value you need for your 99% confidence interval. (Choose the correct critical value from the table of critical values provided.) When you are done, select "Compute". Sample size: X (b) Point estimate: Standard error: Critical values Population standard deviation: Margin of error: F0.005 = 2.576 Critical value: Compute 99% confidence interval: F0.010=2.326 0.0251.960 F0.0501.645 F0.100 = 1.282 Based on your sample, graph the 99% confidence interval for the population mean of the birth weights for all Suffolk sheep. . Enter the lower and upper limits on the graph to show your confidence interval. For the point (), enter the publication's claim of 4.29 kg. 0.00 99% confidence interval: 5.00 10.00 . 0.00 2.00 4.00 6.00 8.00 10.00 Español 8民 Submit Assignment
Expert Solution
steps

Step by step

Solved in 2 steps with 1 images

Blurred answer