
MATLAB: An Introduction with Applications
6th Edition
ISBN: 9781119256830
Author: Amos Gilat
Publisher: John Wiley & Sons Inc
expand_more
expand_more
format_list_bulleted
Related questions
Topic Video
Question
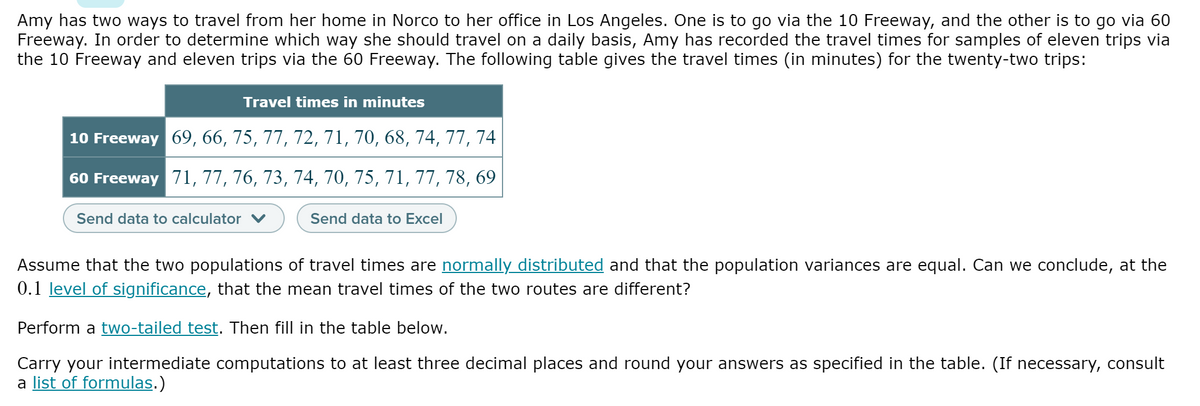

Transcribed Image Text:Amy has two ways to travel from her home in Norco to her office in Los Angeles. One is to go via the 10 Freeway, and the other is to go via 60
Freeway. In order to determine which way she should travel on a daily basis, Amy has recorded the travel times for samples of eleven trips via
the 10 Freeway and eleven trips via the 60 Freeway. The following table gives the travel times (in minutes) for the twenty-two trips:
Travel times in minutes
10 Freeway 69, 66, 75, 77, 72, 71, 70, 68, 74, 77, 74
60 Freeway 71,77, 76, 73, 74, 70, 75, 71, 77, 78, 69
Send data to calculator v
Send data to Excel
Assume that the two populations of travel times are normally distributed and that the population variances are equal. Can we conclude, at the
0.1 level of significance, that the mean travel times of the two routes are different?
Perform a two-tailed test. Then fill in the table below.
Carry your intermediate computations to at least three decimal places and round your answers as specified in the table. (If necessary, consult
a list of formulas.)

Transcribed Image Text:The null hypothesis:
H, : 0
The alternative hypothesis:
H
1
:0
The type of test statistic:
(Choose one) -
The value of the test statistic:
(Round to at least three
decimal places.)
The two critical values at the
0.1 level of significance:
|and ||
(Round to at least three
decimal places.)
Can we conclude that the mean travel times of the
Yes
O No
two routes are different?
Expert Solution
This question has been solved!
Explore an expertly crafted, step-by-step solution for a thorough understanding of key concepts.

This is a popular solution

Trending nowThis is a popular solution!

Step by stepSolved in 3 steps

Knowledge Booster


Learn more about
Need a deep-dive on the concept behind this application? Look no further. Learn more about this topic, statistics and related others by exploring similar questions and additional content below.Similar questions
- Please help me with the below question.arrow_forwardDr. A. Ventura is interested in determining what kinds and how many pets people own in Bakersfield. He stands outside Petco and asks people what kind of pet they own. This is the result of his survey: dog=1; cat=2; bird=3; reptile=4; fish=5; other=6 1,1,2,2,2,1,1,3,2,3,1,1,1,2,2,4,4,2,2,1,1,1,5,4,3,4,1,1,1,2,2,6,1,1,2,2,1,2,1,2,6,3,4,5arrow_forwardIn the provided table, the education information and incomes of 73,736 people are given. The rows are labeled with education status and the columns are labeled with income range. The total of all entries in each row gives the total number of people with the corresponding education status and similarly, the total of all entries of a particular column gives the number of people with the corresponding income range. Please answer subpart 4 and 5.arrow_forward
- You work as a health inspector and must visit each of the 15 restaurants in town once each week, In how many different orders can you make these inspections?arrow_forwardJasmine’s current grades in Algebra I are the following. Jasmine’s grades: Grading System: Tests: 56, 72, 76, and 88 Quizzes: 66, 80, 71, 94 Assignments: 75% Final Exam: 86% Tests: 40% Quizzes: 25% Assignments: 10% Final Exam: 25% a. What is Jasmine’s current grade in the class? b. If she scores 10 points higher on the final exam, what would her new average be in the class?arrow_forwardAmy has two ways to travel from her home in Norco to her office in Los Angeles. One is to go via the 10 Freeway, and the other is to go via 60 Freeway. In order to determine which way she should travel on a daily basis, Amy has recorded the travel times for samples of eight trips via the 10 Freeway and eight trips via the 60 Freeway. The following table gives the travel times (in minutes) for the sixteen trips: Travel times in minutes 10 Freeway 73, 69, 72, 71, 73, 73, 72, 73 60 Freeway 80, 75, 68, 72, 73, 81, 67, 75 Assume that the two populations of travel times are normally distributed and that the population variances are equal. Can we conclude, at the 0.1 level of significance, that the mean travel times of the two routes are different? Perform a two-tailed test. Then fill in the table below. Carry your intermediate computations to at least three decimal places and round your answers as specified in the table. (If necessary, consult a list…arrow_forward
arrow_back_ios
arrow_forward_ios
Recommended textbooks for you
- MATLAB: An Introduction with ApplicationsStatisticsISBN:9781119256830Author:Amos GilatPublisher:John Wiley & Sons Inc
 Probability and Statistics for Engineering and th...StatisticsISBN:9781305251809Author:Jay L. DevorePublisher:Cengage Learning
 Statistics for The Behavioral Sciences (MindTap C...StatisticsISBN:9781305504912Author:Frederick J Gravetter, Larry B. WallnauPublisher:Cengage Learning
  Elementary Statistics: Picturing the World (7th E...StatisticsISBN:9780134683416Author:Ron Larson, Betsy FarberPublisher:PEARSON
 The Basic Practice of StatisticsStatisticsISBN:9781319042578Author:David S. Moore, William I. Notz, Michael A. FlignerPublisher:W. H. Freeman
 Introduction to the Practice of StatisticsStatisticsISBN:9781319013387Author:David S. Moore, George P. McCabe, Bruce A. CraigPublisher:W. H. Freeman
MATLAB: An Introduction with Applications
Statistics
ISBN:9781119256830
Author:Amos Gilat
Publisher:John Wiley & Sons Inc
Probability and Statistics for Engineering and th...
Statistics
ISBN:9781305251809
Author:Jay L. Devore
Publisher:Cengage Learning
Statistics for The Behavioral Sciences (MindTap C...
Statistics
ISBN:9781305504912
Author:Frederick J Gravetter, Larry B. Wallnau
Publisher:Cengage Learning
Elementary Statistics: Picturing the World (7th E...
Statistics
ISBN:9780134683416
Author:Ron Larson, Betsy Farber
Publisher:PEARSON
The Basic Practice of Statistics
Statistics
ISBN:9781319042578
Author:David S. Moore, William I. Notz, Michael A. Fligner
Publisher:W. H. Freeman
Introduction to the Practice of Statistics
Statistics
ISBN:9781319013387
Author:David S. Moore, George P. McCabe, Bruce A. Craig
Publisher:W. H. Freeman