MATLAB: An Introduction with Applications
6th Edition
ISBN: 9781119256830
Author: Amos Gilat
Publisher: John Wiley & Sons Inc
expand_more
expand_more
format_list_bulleted
Question

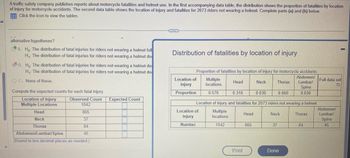
Transcribed Image Text:A traffic safety company publishes reports about motorcycle fatalities and helmet use. In the first accompanying data table, the distribution shows the proportion of fatalities by location
of injury for motorcycle accidents. The second data table shows the location of injury and fatalities for 2073 riders not wearing a helmet. Complete parts (a) and (b) below.
Click the icon to view the tables.
S
alternative hypotheses?
A. Ho: The distribution of fatal injuries for riders not wearing a helmet foll
H₁: The distribution of fatal injuries for riders not wearing a helmet do
B. Ho: The distribution of fatal injuries for riders not wearing a helmet do
H₁: The distribution of fatal injuries for riders not wearing a helmet do
OC. None of these.
Compute the expected counts for each fatal injury.
Observed Count
Location of injury
Multiple Locations
1042
865
37
84
45
Head
Neck
Thorax
Abdomen/Lumbar/Spine
(Round to two decimal places as needed.)
Expected Count
Distribution of fatalities by location of injury
Proportion of fatalities by location of injury for motorcycle accidents
Abdomen/
Lumbar/
Neck
Spine
0.030
Location of
injury
Proportion
Multiple
locations
0.570
Location of
injury
Number
Head
0.310
Print
Location of injury and fatalities for 2073 riders not wearing a helmet
Multiple
locations
1042
Head
0.030
865
Thorax
0.060
37
Neck
Done
Thorax
84
Full data set
D
Abdomen/
Lumbar/
Spine
45
Expert Solution
This question has been solved!
Explore an expertly crafted, step-by-step solution for a thorough understanding of key concepts.
Step by stepSolved in 3 steps

Knowledge Booster
Similar questions
- Which statement below is not true regarding standardized distributions? a. The z-score distribution is an example of a standardized distribution. b. Standardized distributions consist of scores that have been transformed to create predetermined values for the mean and standard deviation. c. Standardized distributions are used to make otherwise dissimilar distributions comparable. d. The values for the mean and standard deviation for a standardized distribution match those values obtained in the original distribution.arrow_forwardHello, may I get an explanation for this SOON PLEASE? I am stuck! Questions are in the image provided.arrow_forwardA researcher collected the following data. Which measure of central tendency for each distribution? Explain that it should be calculated a. IQ scores: 60 72 63 83 68 74 90 86 90 86 74 80 b. Error scores: 10 15 18 15 14 13 42 15 12 14 42 c. Blood types: (-A) (-A) (O) (A) (-AB) (A) (O) (O) (O) (AB) D. Graduation grade: B D C A D F C B C D Darrow_forward
- K Students in an experimental psychology class did research on depression as a sign of stress. A test was administered to a sample of 30 students. The scores are shown below. 43 51 11 90 77 36 64 37 42 72 54 62 36 75 51 72 37 28 38 61 47 63 36 41 22 37 51 46 85 13 To find the 10% trimmed mean of a data set, order the data, delete the lowest 10% of the entries and the highest 10% of the entries, and find the mean of the remaining entries. Complete parts (a) through (c). (a) Find the 10% trimmed mean for the data. The 10% trimmed mean is (Round to the nearest tenth as needed.)arrow_forwardNormal probability plots for three data sets are shown below. Which plot indicates that the data are approximately normally distributed? C. A. O O O O Plot B Plot A Plot C Plots A and B B. Q MEarrow_forwardThe degrees of freedom determine the _____ the t distribution? a. mean of b. variance of c. shape of d. range ofarrow_forward
- 76) A study was conducted to investigate how effective a new diet was in lowering cholesterol. Results for the randomly selected subjects are shown in the table. The differences have a normal distribution. Are the subjects' cholesterol levels lower on average after the diet? Test at the 5% level. Subject A B D E F H I Before 213 211 209 202 220 | 221 242 244 226 After 203 222 193 213 221 206 215 227 205arrow_forward6arrow_forwardCan someone please help? Thank you.arrow_forward
arrow_back_ios
SEE MORE QUESTIONS
arrow_forward_ios
Recommended textbooks for you
 MATLAB: An Introduction with ApplicationsStatisticsISBN:9781119256830Author:Amos GilatPublisher:John Wiley & Sons Inc
 Probability and Statistics for Engineering and th...StatisticsISBN:9781305251809Author:Jay L. DevorePublisher:Cengage Learning
 Statistics for The Behavioral Sciences (MindTap C...StatisticsISBN:9781305504912Author:Frederick J Gravetter, Larry B. WallnauPublisher:Cengage Learning
 Elementary Statistics: Picturing the World (7th E...StatisticsISBN:9780134683416Author:Ron Larson, Betsy FarberPublisher:PEARSON
 The Basic Practice of StatisticsStatisticsISBN:9781319042578Author:David S. Moore, William I. Notz, Michael A. FlignerPublisher:W. H. Freeman
 Introduction to the Practice of StatisticsStatisticsISBN:9781319013387Author:David S. Moore, George P. McCabe, Bruce A. CraigPublisher:W. H. Freeman

MATLAB: An Introduction with Applications
Statistics
ISBN:9781119256830
Author:Amos Gilat
Publisher:John Wiley & Sons Inc

Probability and Statistics for Engineering and th...
Statistics
ISBN:9781305251809
Author:Jay L. Devore
Publisher:Cengage Learning

Statistics for The Behavioral Sciences (MindTap C...
Statistics
ISBN:9781305504912
Author:Frederick J Gravetter, Larry B. Wallnau
Publisher:Cengage Learning

Elementary Statistics: Picturing the World (7th E...
Statistics
ISBN:9780134683416
Author:Ron Larson, Betsy Farber
Publisher:PEARSON

The Basic Practice of Statistics
Statistics
ISBN:9781319042578
Author:David S. Moore, William I. Notz, Michael A. Fligner
Publisher:W. H. Freeman

Introduction to the Practice of Statistics
Statistics
ISBN:9781319013387
Author:David S. Moore, George P. McCabe, Bruce A. Craig
Publisher:W. H. Freeman