Also need... Find standardized test statistic Find P Value Reject or fail

Glencoe Algebra 1, Student Edition, 9780079039897, 0079039898, 2018
18th Edition
ISBN:9780079039897
Author:Carter
Publisher:Carter
Chapter10: Statistics
Section10.4: Distributions Of Data
Problem 7PPS

Related questions
Topic Video
Question
Also need...
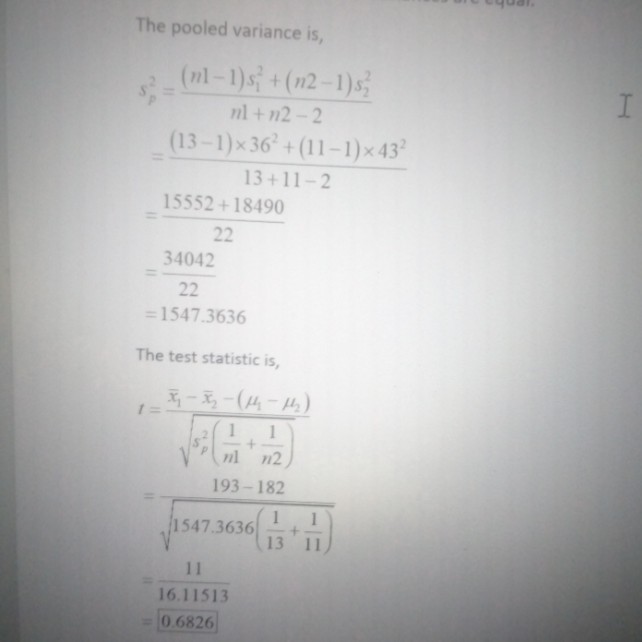
Find standardized test statistic
Find P Value
Reject or fail to reject & is or is not enough evidence

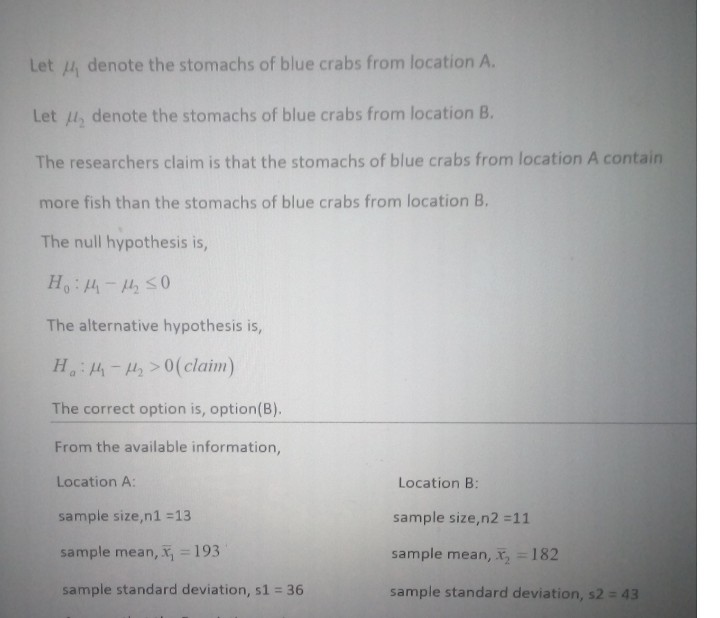
Transcribed Image Text:A researcher claims that the stomachs of blue crabs from Location A contain more fish than the stomachs of blue crabs from Location B. The stomach contents of a sample of 13 blue crabs from Location A contain a mean of 193 milligrams of fish and a
standard deviation of 36 milligrams. The stomach contents of a sample of 11 blue crabs from Location B contain a mean of 182 milligrams of fish and a standard deviation of 43 miligrams. At a = 0.05, can you support the researcher's claim? Assume the
population variances are equal. Complete parts (a) through (d) below.
(a) Identify the null and alternative hypotheses. Choose the correct answer below.
O A. Hg: 41 - P2 0
O B. Họ: H -H2 S0
Ha: H1 "H2 =0
OC. Hg: 41 -2 20
O D. Ho: H - 42=0
0+ 21 - :H
Ha: 41 - 2 0
Expert Solution
Step 1
Step 2

Step by step
Solved in 3 steps with 3 images

Knowledge Booster


Learn more about
Need a deep-dive on the concept behind this application? Look no further. Learn more about this topic, statistics and related others by exploring similar questions and additional content below.Recommended textbooks for you
Glencoe Algebra 1, Student Edition, 9780079039897…
Algebra
ISBN:
9780079039897
Author:
Carter
Publisher:
McGraw Hill
Glencoe Algebra 1, Student Edition, 9780079039897…
Algebra
ISBN:
9780079039897
Author:
Carter
Publisher:
McGraw Hill