MATLAB: An Introduction with Applications
6th Edition
ISBN: 9781119256830
Author: Amos Gilat
Publisher: John Wiley & Sons Inc
expand_more
expand_more
format_list_bulleted
Question

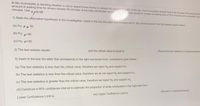
Transcribed Image Text:Al Ain municipality is deciding whether or not to spend more money to reduce the amo ic in the city The muricipality decides ttwt no tetootto
amount of waiting time for drivers exceed 30 minutes. Anormally distributed samp
minutes. Use a 0.05
pad resuts in a mean of wating time f0 minutes andtantd d
1) State the altemative hypothesis in this investigation. Insert in the box the letter that coresponds to the correct anwwer from the ansas gen beiow
(a) Hq:
30
(b) H1 >30
(c) H1: u<30
2) The test statistic equals
and the critical value is equal to
(Round the test statistic to 2 decinmal plae
3) Insert in the box the letter that corresponds to the right conclusion from condlusions given below.
(a) The test statistics is less than the critical value, therefore we reject Ho and support H1.
(b) The test statistics is less than the critical value, therofore we do not reject Ho and support H4.
(c) The test statistics is greater than the critical value, therefore we reject Ho and support Hy.
(4) Construct a 95% confidence interval to estimate the proportion of white employees in the hight-tech firm
(Round to 3 decimal places)
and Upper Confidence Limit is
Lower Confudence Limit is

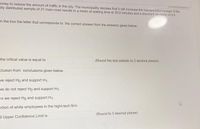
Transcribed Image Text:money to reduce the amount of traffic in the city. The municipality decides that it will increase the transportation budget if the
ally distributed sample of 21 main road results in a mean of waiting time of 35.0 minutes and a standard deviation of 4.5
in the box the letter that corresponds to the correct answer from the answers given below:
the critical value is equal to
(Round the test statistic to 2 decimal places).
clusion from conclusions given below.
ve reject Ho and support H1.
ve do not reject Ho and support H1.
re we reject Ho and support H1.
ortion of white employees in the hight-tech firm:
(Round to 3 decimal places)
a Upper Confidence Limit is
Expert Solution
This question has been solved!
Explore an expertly crafted, step-by-step solution for a thorough understanding of key concepts.
Step by stepSolved in 4 steps

Knowledge Booster
Similar questions
- files Tab Window ents ng Online ucture.com/courses/113555/assignments/2276058 buccess Window Help 30 Homework for Section 6.5 X + Tp 2 The mean cholesterol levels of women age 45-59 in Ghana, Nigeria, and Seychelles is 5.1 mmol/l and the sample of 24 women are selected. standard deviation is 1.0 mmol/l. Assume that cholesterol levels are normally distributed and a random It is possible with rounding for a probability to be 0.0000. The individual is all women age 45-59 in Ghana, Nigeria, and Seychelles problem. a) Identify the individual, variable, type of variable and the random variable X in the context of this The variable information collected from each individual is the cholesterol level This variable is a quantitative -- continuous ✓ variable. The random variable X is as follows: rv X = cholesterol level is normally distributed b) List the givens with the correct symbols. p=5.1 mmol/l ES σ= 1 mmol/l n✓ = 24 c) Identify the random variable X in the context of this problem. Select…arrow_forwardA box contains 5 balls. Two are numbered 3, one is numbered 4, and two are numbered 5. The balls re mixed and one is selected random. After a ball is selected, its number is recorded. Then it replaced. If the experiment is repeated many times, find the mean of the numbers on the balls(round off uour final answer to decimal placesarrow_forwardThe average wait time to get seated at a popular restaurant in the city on a Friday night is 15 minutes. Is the mean wait time different for men who wear a tie? Wait times for 15 randomly selected men who were wearing a tie are shown below. Assume that the distribution of the population is normal. 13, 13, 14, 13, 17, 16, 17, 17, 13, 14, 15, 14, 16, 15, 14 What can be concluded at the the a = 0.10 level of significance level of significance? a. For this study, we should use Select an answer b. The null and alternative hypotheses would be: Ho: ?v Select an answer v H1: Select an answer v c. The test statistic ? v = (please show your answer to 3 decimal places.) d. The p-value = (Please show your answer to 4 decimal places.) e. The p-value is ? v a f. Based on this, we should Select an answer v the null hypothesis. g. Thus, the final conclusion is that ... O The data suggest the population mean is not significantly different from 15 at a = 0.10, so there is statistically insignificant…arrow_forward
- In one of the Stat 2 sections, the students in the section have an average height of 64 inches, with a standard deviation of 3 inches. The GSI happens to be 68 inches. Express the height of the GSI in standard units, relative to the students in the section. Choose the answer below that is closest. Group of answer choices 1.67 3.0 1.5 1.33 4.0 PreviousNextarrow_forwardpercentage may be now, so a of 250 of last year's freshmen 4. 78% of all to in Fall 2015. You think that the a and tind that 84% returned, www.csun.edu/counts/one_year_continuation_rate-plip a. What is p? _ What is the number of successes? What is n? b. Write the hypotheses: Circle the best definition of p. the proportion of all of last year's freshmen who returned the proportion of all 2014 CSUN freshmen who returned the proportion of all CSUN freshmen among the 250 who returned C. Assuming that Ho is true, the sampling distribution of p has a mean of Use the formula to compute the SE of the sampling distribution of p. Complete this sketch of the sampling distribution of p. Put a scale on the horizontal axis. Then locate the result from the sample and shade in area representing the p-value. (Is the area representing the p-value on one side or two sides?) Use StatCrunch to find the p-value for this situation. e. Is there statistically significant evidence that the percentage is…arrow_forwardCalculate the probability that the average number of words for theselected 30 pages of the novel is between 200 to 400 words. State anyassumptions that you made clearly and interpret your answer. knowing that the mean = 246.8 standard deviation = 50.646 pls show all workarrow_forward
- 4* A bag containing 300 ordinary pennies is dropped on a table. What is the approximate prob- ability that between 200 and 230 coins fall heads up?arrow_forwardDetermine the mean, median and mode for the sample of masses of students. Show all work, use proper notation and provide a therefore statement.arrow_forward
arrow_back_ios
arrow_forward_ios
Recommended textbooks for you
 MATLAB: An Introduction with ApplicationsStatisticsISBN:9781119256830Author:Amos GilatPublisher:John Wiley & Sons Inc
 Probability and Statistics for Engineering and th...StatisticsISBN:9781305251809Author:Jay L. DevorePublisher:Cengage Learning
 Statistics for The Behavioral Sciences (MindTap C...StatisticsISBN:9781305504912Author:Frederick J Gravetter, Larry B. WallnauPublisher:Cengage Learning
 Elementary Statistics: Picturing the World (7th E...StatisticsISBN:9780134683416Author:Ron Larson, Betsy FarberPublisher:PEARSON
 The Basic Practice of StatisticsStatisticsISBN:9781319042578Author:David S. Moore, William I. Notz, Michael A. FlignerPublisher:W. H. Freeman
 Introduction to the Practice of StatisticsStatisticsISBN:9781319013387Author:David S. Moore, George P. McCabe, Bruce A. CraigPublisher:W. H. Freeman

MATLAB: An Introduction with Applications
Statistics
ISBN:9781119256830
Author:Amos Gilat
Publisher:John Wiley & Sons Inc

Probability and Statistics for Engineering and th...
Statistics
ISBN:9781305251809
Author:Jay L. Devore
Publisher:Cengage Learning

Statistics for The Behavioral Sciences (MindTap C...
Statistics
ISBN:9781305504912
Author:Frederick J Gravetter, Larry B. Wallnau
Publisher:Cengage Learning

Elementary Statistics: Picturing the World (7th E...
Statistics
ISBN:9780134683416
Author:Ron Larson, Betsy Farber
Publisher:PEARSON

The Basic Practice of Statistics
Statistics
ISBN:9781319042578
Author:David S. Moore, William I. Notz, Michael A. Fligner
Publisher:W. H. Freeman

Introduction to the Practice of Statistics
Statistics
ISBN:9781319013387
Author:David S. Moore, George P. McCabe, Bruce A. Craig
Publisher:W. H. Freeman