A First Course in Probability (10th Edition)
10th Edition
ISBN: 9780134753119
Author: Sheldon Ross
Publisher: PEARSON
expand_more
expand_more
format_list_bulleted
Question
thumb_up100%

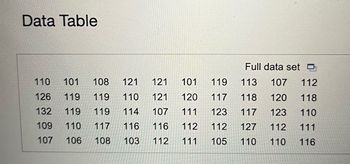
Transcribed Image Text:Data Table
Full data set
119 113 107 112
117
118
120
118
111 123
117
123
110
112 127
112
111
111 105 110
110
116
110 101 108 121 121 101
126
119
119
110 121 120
132 119 119 114
107
109
110 117 116
116 112
107
106
108 103 112

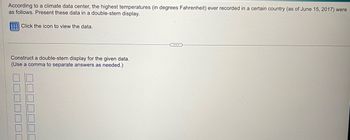
Transcribed Image Text:According to a climate data center, the highest temperatures (in degrees Fahrenheit) ever recorded in a certain country (as of June 15, 2017) were
as follows. Present these data in a double-stem display.
Click the icon to view the data.
Construct a double-stem display for the given data.
(Use a comma to separate answers as needed.)
Expert Solution
This question has been solved!
Explore an expertly crafted, step-by-step solution for a thorough understanding of key concepts.
This is a popular solution
Trending nowThis is a popular solution!
Step by stepSolved in 3 steps

Knowledge Booster
Similar questions
- The first five rows of the BIRTHS data set are shown here. For GENDER 1 =male and 0 = female, WEIGHT is birth weight in grams, and CHARGES is in dollars. FACis facility, ADMIT and DISCHARGE are named days of the week. FAC INSURANCE GENDER ADMIT DISCHARGE WEIGHT CHARGES Albany Medicaid 0 FRI SUN 3500 13986 Albany Blue Cross 1 FRI SUN 3900 3633 Bellvue Blue Cross 0 WED THU 900 359091 Albany Self Pay 1 MON SAT 2800 8537 Olean Medicaid 1 FRI SUN 3700 3633 Describe the appropriate level of measure for each of the variables of the data. (Nominal,Ordinal, or Numerical - discrete, or Numerical - continuous).arrow_forwardUse the following cell phone airport data speeds (Mbps) from a particular network. Find Q₁. 0.2 0.2 0.4 0.7 0.8 0.9 1.9 2.5 2.6 5.1 6.4 6.5 8.5 10.5 13.3 0.2 0.8 2.3 5.6 8.9 Q₁ Mbps (Type an integer or a decimal. Do not round.) 0.3 0.9 2.5 6.4 11.1 C 0.4 0.9 2.9 6.5 13.4 0.4 1.1 3.1 7.1 13.4 0.5 1.2 3.4 7.2 14.8 0.5 1.2 3.8 7.8 14.9 0.6 1.8 4.4 8.1 25.5arrow_forwardWeatherwise is a magazine published by the American Meteorological Society. One issue gives a rating system used to classify Nor'easter storms that frequently hit New England and can cause much damage near the ocean. A severe storm has an average peak wave height of ? = 16.4 feet for waves hitting the shore. Suppose that a Nor'easter is in progress at the severe storm class rating. Peak wave heights are usually measured from land (using binoculars) off fixed cement piers. Suppose that a reading of 38 waves showed an average wave height of x = 16.7 feet. Previous studies of severe storms indicate that ? = 3.5 feet. Does this information suggest that the storm is (perhaps temporarily) increasing above the severe rating? Use ? = 0.01. a) What is the value of the sample test statistic? (Round your answer to two decimal places.)arrow_forward
- Weatherwise is a magazine published by the American Meteorological Society. One issue gives a rating system used to classify Nor'easter storms that frequently hit New England and can cause much damage near the ocean. A severe storm has an average peak wave height of ? = 16.4 feet for waves hitting the shore. Suppose that a Nor'easter is in progress at the severe storm class rating. Peak wave heights are usually measured from land (using binoculars) off fixed cement piers. Suppose that a reading of 40 waves showed an average wave height of x = 17.5 feet. Previous studies of severe storms indicate that ? = 4.0 feet. Does this information suggest that the storm is (perhaps temporarily) increasing above the severe rating? Use ? = 0.01. Solve the problem using the critical region method of testing (i.e., traditional method). (Round your answers to two decimal places.) test statistic = critical value = State your conclusion in the context of the application. Reject the null…arrow_forwardA drink vendor randomly asked college students how many soft drinks they had consumed during the past week. Their answers were as follows: 5,0,2,1.1.9,0,1,0,3,1.1.4,3,4, and 7. a. Make a frequency table (NOT grouped). b. Make a histogram based on the frequency table. c. Make a frequency polygon based on the frequency table. d. Describe the shape of the histogram (i.e., mode?, skewed? etc.).arrow_forwardCalculate the Midrange of the following data set:- 135 168 174 127 115 142 146 122arrow_forward
- Weatherwise is a magazine published by the American Meteorological Society. One issue gives a rating system used to classify Nor'easter storms that frequently hit New England and can cause much damage near the ocean. A severe storm has an average peak wave height of ? = 16.4 feet for waves hitting the shore. Suppose that a Nor'easter is in progress at the severe storm class rating. Peak wave heights are usually measured from land (using binoculars) off fixed cement piers. Suppose that a reading of 32 waves showed an average wave height of x = 17.3 feet. Previous studies of severe storms indicate that ? = 3.5 feet. Does this information suggest that the storm is (perhaps temporarily) increasing above the severe rating? Use ? = 0.01.arrow_forwardWeatherwise is a magazine published by the American Meteorological Society. One issue gives a rating system used to classify Nor'easter storms that frequently hit New England and can cause much damage near the ocean. A severe storm has an average peak wave height of ? = 16.4 feet for waves hitting the shore. Suppose that a Nor'easter is in progress at the severe storm class rating. Peak wave heights are usually measured from land (using binoculars) off fixed cement piers. Suppose that a reading of 38 waves showed an average wave height of x = 17.3 feet. Previous studies of severe storms indicate that ? = 3.5 feet. Does this information suggest that the storm is (perhaps temporarily) increasing above the severe rating? Use ? = 0.01. a) Estimate the P-value. choose one: P-value > 0.2500. 100 < P-value < 0.250 0.050 < P-value < 0.1000. 010 < P-value < 0.050 P-value < 0.010 b) Sketch the sampling distribution and show the area corresponding to the P-value.…arrow_forwardThe Nenana Ice Classic is an annual contest to guess the exact time in the spring thaw when a tripod erected on the frozen. Tanana River near Nenana, Alaska, will fall through the ice. The contest has been run since 1917. The 2017 jackpot was $267,444. The table gives simplified data that record only the date on which the tripod fell each year. The earliest date so far is April 20. To make the data casier to use, the table gives the date each year in days starting with April 20. That is, April 20 is 1, April 21 is 2, and so on. Days from April 20 for the Tanana River tripod to fall Duy Year 1917 1918 1919 1920 1921 1922 1923 1924 1925 1926 1927 1928 1929 1930 1931 1932 1933 Year 1948 1969 1970 1971 1972 1973 1974 1975 1976 1977 1978 1979 1980 1981 1982 Days from April 20 for the Tanana River tripod to fall 1983 11 1984 22 14 22 22 23 20 22 16 7 23 17 16 19 21 12 19 Day 19 9 15 19 21 15 17 21 17 11. 11 10 11 21 10 20 Days from April 20 for the Tanana River tripod to fall Year 1934 1935…arrow_forward
- please answer fullyarrow_forwardAn effect size of .55 would be considered?arrow_forwardWeatherwise is a magazine published by the American Meteorological Society. One issue gives a rating system used to classify Nor'easter storms that frequently hit New England and can cause much damage near the ocean. A severe storm has an average peak wave height of ? = 16.4 feet for waves hitting the shore. Suppose that a Nor'easter is in progress at the severe storm class rating. Peak wave heights are usually measured from land (using binoculars) off fixed cement piers. Suppose that a reading of 32 waves showed an average wave height of x = 16.9 feet. Previous studies of severe storms indicate that ? = 3.5 feet. Does this information suggest that the storm is (perhaps temporarily) increasing above the severe rating? Use ? = 0.01. (a) What is the level of significance?State the null and alternate hypotheses. H0: ? = 16.4 ft; H1: ? < 16.4 ftH0: ? > 16.4 ft; H1: ? = 16.4 ft H0: ? < 16.4 ft; H1: ? = 16.4 ftH0: ? = 16.4 ft; H1: ? > 16.4 ftH0: ? = 16.4 ft; H1: ? ≠ 16.4 ft…arrow_forward
arrow_back_ios
arrow_forward_ios
Recommended textbooks for you
 A First Course in Probability (10th Edition)ProbabilityISBN:9780134753119Author:Sheldon RossPublisher:PEARSON

A First Course in Probability (10th Edition)
Probability
ISBN:9780134753119
Author:Sheldon Ross
Publisher:PEARSON
