
MATLAB: An Introduction with Applications
6th Edition
ISBN: 9781119256830
Author: Amos Gilat
Publisher: John Wiley & Sons Inc
expand_more
expand_more
format_list_bulleted
Related questions
Question
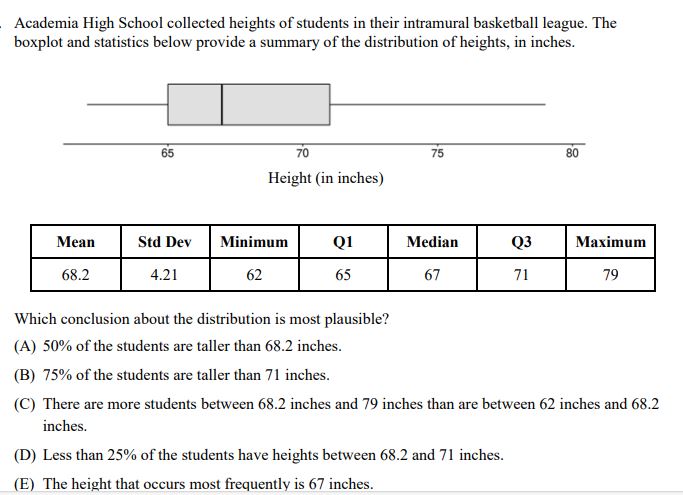

Transcribed Image Text:Academia High School collected heights of students in their intramural basketball league. The
boxplot and statistics below provide a summary of the distribution of heights, in inches.
65
70
Height (in inches)
75
80
Mean
Std Dev Minimum
Q1
Median
Q3
Maximum
68.2
4.21
62
65
67
71
79
Which conclusion about the distribution is most plausible?
(A) 50% of the students are taller than 68.2 inches.
(B) 75% of the students are taller than 71 inches.
(C) There are more students between 68.2 inches and 79 inches than are between 62 inches and 68.2
inches.
(D) Less than 25% of the students have heights between 68.2 and 71 inches.
(E) The height that occurs most frequently is 67 inches.
SAVE
AI-Generated Solution
info
AI-generated content may present inaccurate or offensive content that does not represent bartleby’s views.
Unlock instant AI solutions
Tap the button
to generate a solution
to generate a solution
Click the button to generate
a solution
a solution
Knowledge Booster

Similar questions
- The median for the given set of six ordered data values is 31.5. 7 12 23 _ 41 49 What is the missing value? The missing value isarrow_forwardThe average house has 14 paintings on its walls. Is the mean larger for houses owned by teachers? The data show the results of a survey of 14 teachers who were asked how many paintings they have in their houses. Assume that the distribution of the population is normal. 15, 13, 16, 16, 17, 14, 14, 15, 13, 13, 15, 16, 15, 16 What can be concluded at the a = 0.01 level of significance? a. For this study, we should use Select an answer b. The null and alternative hypotheses would be: Но: ? Select an answer v H: ?v Select an answer v c. The test statistic ? v = (please show your answer to 3 decimal places.) d. The p-value = (Please show your answer to 4 decimal places.) e. The p-value is ? va f. Based on this, we should Select an answer v the null hypothesis. g. Thus, the final conclusion is that ... O The data suggest that the population mean number of paintings that are in teachers' houses is not significantly more than 14 at a = 0.01, so there is insufficient evidence to conclude that…arrow_forwardThe number of credits being taken by a sample of 13 full-time college students are listed below. Find the mean, median, and mode of the data, if possible. If any measure cannot be found or does not represent the center of the data, explain why. 88 11 11 8 9 77777 7 10 TMV UIG TIHVUG. VGIGLIUIG COITGGL GITVIGG VGIVW aiIU, II TIGL655aiy, mI MUIG QISWGI VUX LU Compitic yoUr GilviG. O A. The mode(s) is/are (Type an integer or decimal rounded to one decimal place as needed. Use a comma to separate answers as needed.) O B. The data set does not have a mode. Does (Do) the mode(s) represent the center of the data? O A. The mode(s) represent(s) the center. O B. The mode(s) does (do) not represent the center because it (one) is the largest data value. O C. The mode(s) does (do) not represent the center because it (one) is the smallest data value. O D. The mode(s) does (do) not represent the center because it (they) is (are) not a data value. O E. The data set does not have a mode.arrow_forward
- Q个4 3 of 6 200% 5.) If the number 12.3 were added to the dataset below, which statement best describes how its mean and median would change? 70.1, 72.3, 75.6, 78.9, 81.0, 83.8, 84.5, 91.2 A.) The mean and median both decrease, but the mean decreases more. B.) The mean and median both decrease, but the median decreases more. C.) The median doesn't change, but the mean decreases. D.) The mean doesn't change, but the median decreases. 021 Illuminate EducationTM, Inc. ? XP OCa 29arrow_forwardd. Interpret the value of IQR in the above table.arrow_forwardState, with an explanation, whether the mean, median, or mode gives the best description of the following average. The average diameter of potatoes in a 10-pound bag Which measurement gives the best description of the given average? The v is the best because the distributionarrow_forward
arrow_back_ios
arrow_forward_ios
Recommended textbooks for you
- MATLAB: An Introduction with ApplicationsStatisticsISBN:9781119256830Author:Amos GilatPublisher:John Wiley & Sons Inc
 Probability and Statistics for Engineering and th...StatisticsISBN:9781305251809Author:Jay L. DevorePublisher:Cengage Learning
 Statistics for The Behavioral Sciences (MindTap C...StatisticsISBN:9781305504912Author:Frederick J Gravetter, Larry B. WallnauPublisher:Cengage Learning
  Elementary Statistics: Picturing the World (7th E...StatisticsISBN:9780134683416Author:Ron Larson, Betsy FarberPublisher:PEARSON
 The Basic Practice of StatisticsStatisticsISBN:9781319042578Author:David S. Moore, William I. Notz, Michael A. FlignerPublisher:W. H. Freeman
 Introduction to the Practice of StatisticsStatisticsISBN:9781319013387Author:David S. Moore, George P. McCabe, Bruce A. CraigPublisher:W. H. Freeman
MATLAB: An Introduction with Applications
Statistics
ISBN:9781119256830
Author:Amos Gilat
Publisher:John Wiley & Sons Inc
Probability and Statistics for Engineering and th...
Statistics
ISBN:9781305251809
Author:Jay L. Devore
Publisher:Cengage Learning
Statistics for The Behavioral Sciences (MindTap C...
Statistics
ISBN:9781305504912
Author:Frederick J Gravetter, Larry B. Wallnau
Publisher:Cengage Learning
Elementary Statistics: Picturing the World (7th E...
Statistics
ISBN:9780134683416
Author:Ron Larson, Betsy Farber
Publisher:PEARSON
The Basic Practice of Statistics
Statistics
ISBN:9781319042578
Author:David S. Moore, William I. Notz, Michael A. Fligner
Publisher:W. H. Freeman
Introduction to the Practice of Statistics
Statistics
ISBN:9781319013387
Author:David S. Moore, George P. McCabe, Bruce A. Craig
Publisher:W. H. Freeman