Human Anatomy & Physiology (11th Edition)
11th Edition
ISBN: 9780134580999
Author: Elaine N. Marieb, Katja N. Hoehn
Publisher: PEARSON
expand_more
expand_more
format_list_bulleted
Concept explainers
Question
Solve. 3

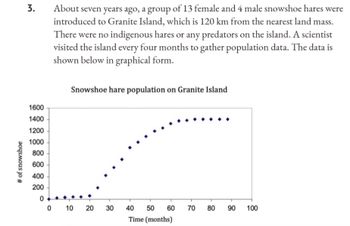
Transcribed Image Text:# of snowshoe
3.
About seven years ago, a group of 13 female and 4 male snowshoe hares were
introduced to Granite Island, which is 120 km from the nearest land mass.
There were no indigenous hares or any predators on the island. A scientist
visited the island every four months to gather population data. The data is
shown below in graphical form.
Snowshoe hare population on Granite Island
1600
1400
1200
1000
800
600
400
200
0
30
40 50 60 70 80 90
Time (months)
0
10
20
100

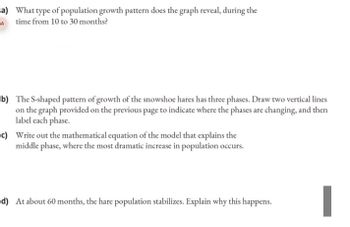
Transcribed Image Text:a) What type of population growth pattern does the graph reveal, during the
A time from 10 to 30 months?
b) The S-shaped pattern of growth of the snowshoe hares has three phases. Draw two vertical lines
on the graph provided on the previous page to indicate where the phases are changing, and then
label each phase.
c) Write out the mathematical equation of the model that explains the
middle phase, where the most dramatic increase in population occurs.
d) At about 60 months, the hare population stabilizes. Explain why this happens.
I
Expert Solution
This question has been solved!
Explore an expertly crafted, step-by-step solution for a thorough understanding of key concepts.
Step by stepSolved in 3 steps with 1 images

Knowledge Booster
Learn more about
Need a deep-dive on the concept behind this application? Look no further. Learn more about this topic, biology and related others by exploring similar questions and additional content below.Similar questions
- Why discuss hydrodynamics first (vs pressure or temperature etc..)?arrow_forwardneed help answeringarrow_forwardUnlike a rabbit, running all-out for a few moments to escape a predator, migratory birds require energy for extended periods of time. For example, ducks generally fly several thousand miles during their annual migration. The flight muscles of migratory birds have a high oxidative capacity and obtain the necessary ATP through the oxidation of acetyl-CoA (obtained from fats) via the citric acid cycle. Compare the regulation of muscle glycolysis during short-term intense activity, as in a fleeing rabbit, and during extended activity, as in the migrating duck. Why must the regulation in these two settings be different? Extended activity requires the highly efficient anaerobic metabolism of fats, rather than the less efficient aerobic metabolism of glucose. Extended activity requires the highly efficient aerobic oxidation of fats, rather than the less efficient anaerobic metabolism of glucose. Extended activity stimulates glycolysis because the concentrations of citrate and acetyl-CoA are…arrow_forward
- ACTIVITY 6.1 Complete the table below Example of Carbohydrate Source Functionarrow_forwardExercise C: Spectrophotometry Watch this video to learn how a spectrophotometer works. For additional information, you can read about using a spectrophotometer in your textbook’s “BioSkills 8: Using Spectrophotometry”. A spectrophotometer was used to determine the absorbance of 2 pigments between 400 nm and 710 nm, the range of wavelengths that is associated with visible light. The table below contains the absorbance values for each pigment (“Pigment 1” and “Pigment 2”) at wavelengths separated by approximately 10 nm. Wavelength Pigment 1 Pigment 2 400 0.097 0.117 410 0.088 0.127 420 0.099 0.143 430 0.113 0.158 440 0.129 0.181 450 0.158 0.184 460 0.145 0.171 470 0.085 0.164 480 0.041 0.143 490 0.024 0.089 500 0.022 0.048 510 0.019 0.023 520 0.018 0.014 530 0.020 0.010 540 0.019 0.008 550 0.020 0.008 560 0.022 0.009 570 0.023 0.008…arrow_forwardConsider the following three diagrams of a nerve cell membrane. They show resting potential, depolarization, and hyperpolarization. Figure out which one is which, then draw them in the order they occur in a cell that undergoes an action potential outside + Na* inside K* Na* Nat K Nat K Na potential: -80 mV outside + Na K* Na* inside Na+ K Nat Na* K+ potential: +30 mV outside Na Na Na Na* K+ inside K* Na* Kt potential: -70 mVarrow_forward
- Lab: Borneol to borneone using Oxone in the presence of NaCl Testing using KI We performed a chemical test to check that the oxidant was fully quenched. Explain how this test works chemically. Which chemical is responsible for the dark brown color that is indicative of a positive test, write down the chemical reactions involved in the process?arrow_forwardOK with a calculator.... but what does the work look like to get the 2.68 without a calculator?arrow_forwardStructure activity relationship of pindololarrow_forward
- A. Many, but not all, of the electron transfer reactions involve metal ions. Say if it is true or false justify only if it is falsearrow_forwardFill in the blank: When electron acceptors are not available in anoxic environments, carbon will be catabolized by________________.arrow_forwardD10 Discuss some potential consequences for a patient using an unstable emulsion containing a hydrophobic drugarrow_forward
arrow_back_ios
SEE MORE QUESTIONS
arrow_forward_ios
Recommended textbooks for you
 Human Anatomy & Physiology (11th Edition)BiologyISBN:9780134580999Author:Elaine N. Marieb, Katja N. HoehnPublisher:PEARSON
 Biology 2eBiologyISBN:9781947172517Author:Matthew Douglas, Jung Choi, Mary Ann ClarkPublisher:OpenStax
 Anatomy & PhysiologyBiologyISBN:9781259398629Author:McKinley, Michael P., O'loughlin, Valerie Dean, Bidle, Theresa StouterPublisher:Mcgraw Hill Education,
 Molecular Biology of the Cell (Sixth Edition)BiologyISBN:9780815344322Author:Bruce Alberts, Alexander D. Johnson, Julian Lewis, David Morgan, Martin Raff, Keith Roberts, Peter WalterPublisher:W. W. Norton & Company
 Laboratory Manual For Human Anatomy & PhysiologyBiologyISBN:9781260159363Author:Martin, Terry R., Prentice-craver, CynthiaPublisher:McGraw-Hill Publishing Co.
 Inquiry Into Life (16th Edition)BiologyISBN:9781260231700Author:Sylvia S. Mader, Michael WindelspechtPublisher:McGraw Hill Education

Human Anatomy & Physiology (11th Edition)
Biology
ISBN:9780134580999
Author:Elaine N. Marieb, Katja N. Hoehn
Publisher:PEARSON

Biology 2e
Biology
ISBN:9781947172517
Author:Matthew Douglas, Jung Choi, Mary Ann Clark
Publisher:OpenStax

Anatomy & Physiology
Biology
ISBN:9781259398629
Author:McKinley, Michael P., O'loughlin, Valerie Dean, Bidle, Theresa Stouter
Publisher:Mcgraw Hill Education,

Molecular Biology of the Cell (Sixth Edition)
Biology
ISBN:9780815344322
Author:Bruce Alberts, Alexander D. Johnson, Julian Lewis, David Morgan, Martin Raff, Keith Roberts, Peter Walter
Publisher:W. W. Norton & Company

Laboratory Manual For Human Anatomy & Physiology
Biology
ISBN:9781260159363
Author:Martin, Terry R., Prentice-craver, Cynthia
Publisher:McGraw-Hill Publishing Co.

Inquiry Into Life (16th Edition)
Biology
ISBN:9781260231700
Author:Sylvia S. Mader, Michael Windelspecht
Publisher:McGraw Hill Education