MATLAB: An Introduction with Applications
6th Edition
ISBN: 9781119256830
Author: Amos Gilat
Publisher: John Wiley & Sons Inc
expand_more
expand_more
format_list_bulleted
Question
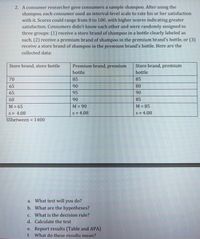
Answer B,C,D, and E please.

Transcribed Image Text:2. A consumer researcher gave consumers a sample shampoo. After using the
shampoo, each consumer used an interval-level scale to rate his or her satisfaction
with it. Scores could range from 0 to 100, with higher scores indicating greater
satisfaction. Consumers didn't know each other and were randomly assigned to
three groups: (1) receive a store brand of shampoo in a bottle clearly labeled as
such, (2) receive a premium brand of shamp00 in the premium brand's bottle, or (3)
receive a store brand of shampoo in the premium brand's bottle. Here are the
collected data:
Premium brand, premium
bottle
Store brand, premium
bottle
Store brand, store bottle
70
85
85
65
90
80
65
95
90
60
90
85
M = 65
M = 90
M = 85
S= 4.08
S = 4.08
S= 4.08
SSbetween = 1400
a. What test will you do?
b. What are the hypotheses?
c. What is the decision rule?
d. Calculate the test
e. Report results (Table and APA)
f.
What do these results mean?
Expert Solution
This question has been solved!
Explore an expertly crafted, step-by-step solution for a thorough understanding of key concepts.
Step by stepSolved in 2 steps with 5 images

Knowledge Booster
Similar questions
- Find the first 5 terms a1 = 9; d = -2arrow_forwardA certain restaurant prepared meals during the pandemic for the first-responders. If they prepared 5 spaghetti meals for every 7 meat meals, how many meat meals were there if there were 600 meals prepared?arrow_forwardOne third of the cars available for sale in a dealership are used cars. If there are 20 new cars, how many cars are there in the dealership?arrow_forward
- jim has 10 apples. give Ted 3 how much apples does he have left?arrow_forwardJake is a train conductor. Every day he rides 20 miles to Jonesboro, 17.5 miles to Carver City, and 76.3 miles to Clinton. He then travels the same route back home. How many miles does he travel each day?arrow_forwardLet A = {1, 2} and B = {3, 4}. Write A × B. How many subsets will A × B have?List them.arrow_forward
arrow_back_ios
arrow_forward_ios
Recommended textbooks for you
 MATLAB: An Introduction with ApplicationsStatisticsISBN:9781119256830Author:Amos GilatPublisher:John Wiley & Sons Inc
 Probability and Statistics for Engineering and th...StatisticsISBN:9781305251809Author:Jay L. DevorePublisher:Cengage Learning
 Statistics for The Behavioral Sciences (MindTap C...StatisticsISBN:9781305504912Author:Frederick J Gravetter, Larry B. WallnauPublisher:Cengage Learning
 Elementary Statistics: Picturing the World (7th E...StatisticsISBN:9780134683416Author:Ron Larson, Betsy FarberPublisher:PEARSON
 The Basic Practice of StatisticsStatisticsISBN:9781319042578Author:David S. Moore, William I. Notz, Michael A. FlignerPublisher:W. H. Freeman
 Introduction to the Practice of StatisticsStatisticsISBN:9781319013387Author:David S. Moore, George P. McCabe, Bruce A. CraigPublisher:W. H. Freeman

MATLAB: An Introduction with Applications
Statistics
ISBN:9781119256830
Author:Amos Gilat
Publisher:John Wiley & Sons Inc

Probability and Statistics for Engineering and th...
Statistics
ISBN:9781305251809
Author:Jay L. Devore
Publisher:Cengage Learning

Statistics for The Behavioral Sciences (MindTap C...
Statistics
ISBN:9781305504912
Author:Frederick J Gravetter, Larry B. Wallnau
Publisher:Cengage Learning

Elementary Statistics: Picturing the World (7th E...
Statistics
ISBN:9780134683416
Author:Ron Larson, Betsy Farber
Publisher:PEARSON

The Basic Practice of Statistics
Statistics
ISBN:9781319042578
Author:David S. Moore, William I. Notz, Michael A. Fligner
Publisher:W. H. Freeman

Introduction to the Practice of Statistics
Statistics
ISBN:9781319013387
Author:David S. Moore, George P. McCabe, Bruce A. Craig
Publisher:W. H. Freeman