
MATLAB: An Introduction with Applications
6th Edition
ISBN: 9781119256830
Author: Amos Gilat
Publisher: John Wiley & Sons Inc
expand_more
expand_more
format_list_bulleted
Related questions
Question
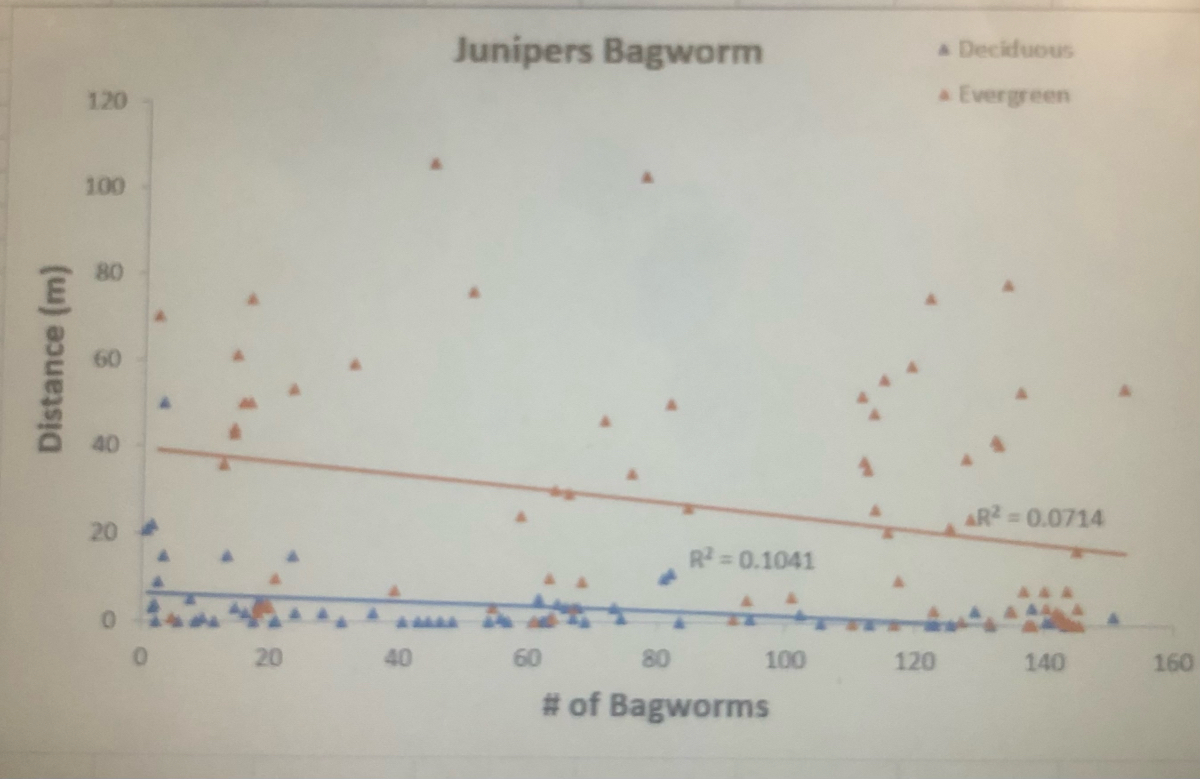

Transcribed Image Text:Distance (m)
120
100
80
60
40
20
0
20
40
Junipers Bagworm
60
80
R² = 0.1041
100
# of Bagworms
120
* Deciduous
Evergreen
AR² = 0.0714
140
160

Transcribed Image Text:a. What kind of relationship is being shown for bagworm number on evergreen
trees and distance to nearest juniper and what does that mean?
b. Does this appear to support our hypothesis?
c. How much of the variation in bagworm numbers on evergreen trees is being
explained by the distance from the nearest juniper variable (you can get this
information from your current graph)?
d. How much of the variation in bagworm numbers on deciduous trees is being
explained by the distance from the nearest juniper variable (you can get this
information from your current graph)?
Expert Solution
This question has been solved!
Explore an expertly crafted, step-by-step solution for a thorough understanding of key concepts.

Step by stepSolved in 3 steps with 2 images

Knowledge Booster

Similar questions
- Given the following pairs of value of the variables: Advertisement expenses and revenue generation (in million) of a hospital:(a) make a scatter diagram.,(b) Do you think that there is any relationship between the variables?(c) Is it positive or negative?(d) is it high or low? and,(e) by graphic inspection draw an estimated line First 3 questions have been answered, subparts to be answered only ( D, E ) Advertisement expenses in million 2 3 5 6 8 9 Revenues generated in millions 6 5 7 8 12 11arrow_forwardQuestion 19arrow_forwardQuestion 30. Consider the following scatter plot. -2 -1 1 х1 The coefficient of correlation of the two variables . a) is negative. b) is positive. c) should have an absolute value greater than 0.4. d) should be close to zero. -2 L-arrow_forward
- Please do not give solution in image format thanku Load "diabetes" datasets from SKlearn and do the PCA for n=3, and plot the data. 1. What is the variance (%) covered by the first 3 components? How is this percentage of variance computed? 2. Is there any correlation between these three components? 3. Apply t-SNE on the same dataset, select the first 3 components and plot them. 4. Report the comparison between the results obtained using t-SNE and PCarrow_forwarda rectangle is always a parralellogram. Always True. Since a rectangle is below the parallelogram in hierarchy, it inherits all the properties of a parallelogram. Therefore, it is a parallelogram in every case. Question: Sketch an example of when it is true and an example of when its not. Explain thoroughly and add values to justify the explanation.arrow_forwardQuestion 3 The owner of a restaurant wants to find out more about where his patrons are coming from. One day he decided to gather data about the distance (in miles) that people commuted to get to his restaurant. People reported the following distances traveled: 14, 6, 3, 2, 4, 15, 11, 8, 1, 7, 2, 1, 3, 4, 10, 22, 20 He wants to create a graph that helps him understand the spread of distances (and the median distance) that people travel. a) What kind of graph should he create and why? b) Create the graph and indicate all its features. c) Measure the skewness on the spread of distance and interpret your result.arrow_forward
- Part e & d pleasearrow_forwardIn a city of 45,000 homes, a survey was taken to determine the number with Wi-Fi access. Of the 500 homes surveyed, 300 had Wi-Fi access. Estimate the number of homes in the city that have Wi-Fi access.arrow_forwardQuestion 4 A graphical summary of data that is based on a five-number summary is a a. scatter diagram b. histogram c. box plot d. stem-and-leaf displayarrow_forward
- Please solve question 5.arrow_forwardSuppose a researcher collects data on the bacterial contamination, measured in colony-forming unit per milliliter, for both upstream and downstream sections of 35 rivers. The data is plotted with upstream bacterial contamination on the horizontal axis and downstream bacterial contamination on the vertical axis. The Scioto River is an outlier in the ?y‑direction. What must be true about this river? The upstream bacterial contamination for this river is much higher or lower than the rest of the rivers in the data set. The downstream bacterial contamination for this river is much higher or lower than other rivers in the data set that have similar upstream bacterial contamination. This river is an influential observation. The downstream bacterial contamination for this river is much higher or much lower than the rest of the rivers in the data set. The absolute value of the residual of this river is large.arrow_forwardFor the following line graph, State at least one type of conclusion that could be made from the data provided for the KPI. Suggest one other data source that would provide more information to make data-driven decisions. Explain what information that source would supply. I used the line graph btw. Examples: 1)The KPI webpage for South Texas College provides information on the proportion of graduates who find employment. According to the data, over the past five years, the proportion of graduates who find work has risen annually. Data on the percentage of students who are employed in their field of study after graduation, the percentage of students who are employed full-time after graduation, and the percentage of students who are satisfied with their job after graduation would also be useful in making decisions about post-graduation success. This information would shed light on the factors that are causing the rise in the proportion of graduates who find employment. 2)The…arrow_forward
arrow_back_ios
SEE MORE QUESTIONS
arrow_forward_ios
Recommended textbooks for you
- MATLAB: An Introduction with ApplicationsStatisticsISBN:9781119256830Author:Amos GilatPublisher:John Wiley & Sons Inc
 Probability and Statistics for Engineering and th...StatisticsISBN:9781305251809Author:Jay L. DevorePublisher:Cengage Learning
 Statistics for The Behavioral Sciences (MindTap C...StatisticsISBN:9781305504912Author:Frederick J Gravetter, Larry B. WallnauPublisher:Cengage Learning
  Elementary Statistics: Picturing the World (7th E...StatisticsISBN:9780134683416Author:Ron Larson, Betsy FarberPublisher:PEARSON
 The Basic Practice of StatisticsStatisticsISBN:9781319042578Author:David S. Moore, William I. Notz, Michael A. FlignerPublisher:W. H. Freeman
 Introduction to the Practice of StatisticsStatisticsISBN:9781319013387Author:David S. Moore, George P. McCabe, Bruce A. CraigPublisher:W. H. Freeman
MATLAB: An Introduction with Applications
Statistics
ISBN:9781119256830
Author:Amos Gilat
Publisher:John Wiley & Sons Inc
Probability and Statistics for Engineering and th...
Statistics
ISBN:9781305251809
Author:Jay L. Devore
Publisher:Cengage Learning
Statistics for The Behavioral Sciences (MindTap C...
Statistics
ISBN:9781305504912
Author:Frederick J Gravetter, Larry B. Wallnau
Publisher:Cengage Learning
Elementary Statistics: Picturing the World (7th E...
Statistics
ISBN:9780134683416
Author:Ron Larson, Betsy Farber
Publisher:PEARSON
The Basic Practice of Statistics
Statistics
ISBN:9781319042578
Author:David S. Moore, William I. Notz, Michael A. Fligner
Publisher:W. H. Freeman
Introduction to the Practice of Statistics
Statistics
ISBN:9781319013387
Author:David S. Moore, George P. McCabe, Bruce A. Craig
Publisher:W. H. Freeman