MATLAB: An Introduction with Applications
6th Edition
ISBN: 9781119256830
Author: Amos Gilat
Publisher: John Wiley & Sons Inc
expand_more
expand_more
format_list_bulleted
Question

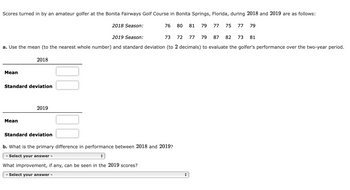
Transcribed Image Text:Scores turned in by an amateur golfer at the Bonita Fairways Golf Course in Bonita Springs, Florida, during 2018 and 2019 are as follows:
Mean
Standard deviation
Mean
2019 Season:
73
72 77 79 87 82 73
a. Use the mean (to the nearest whole number) and standard deviation (to 2 decimals) to evaluate the golfer's performance over the two-year period.
2018
2019
2018 Season:
Standard deviation
76
80 81 79 77 75 77 79
b. What is the primary difference in performance between 2018 and 2019?
- Select your answer -
+
What improvement, if any, can be seen in the 2019 scores?
- Select your answer -
81
+
Expert Solution
This question has been solved!
Explore an expertly crafted, step-by-step solution for a thorough understanding of key concepts.
Step by stepSolved in 3 steps with 4 images

Knowledge Booster
Similar questions
- Using a normal curve table, give the percentage of scores between the mean and a Z score of (a) 0.72, (b) 0.82, (c) 1.46, (d) 1.56, (e) - 0.72. Click here to view page 1 of the table. Click here to view page 2 of the table. Click here to view page 3 of the table. Click here to view page 4 of the table.arrow_forwardyou wish to estimate the mean cholesteral levels of patients two days after they had a heart attack. To estimate the mean you collect data from 28 heart patients. How do I find the the individual, variable, population peremeter, sample, and statistic?arrow_forwardHow can I Calculate the mean and median of the data set by hand.arrow_forward
- What is the FSTAT and P-Value?arrow_forwardUse the magnitudes (Richter scale) of the earthquakes listed in the data set below. Find the mean and median of this data set. Is the magnitude of an earthquake measuring 7.0 on the Richter scale an outlier (data value that is very far away from the others) when considered in the context of the sample data given in this data set? Explain. a. Find the mean and median of the data set using a calculator or similar data analysis technology. The mean of the data set is (Round to three decimal places as needed.) b. The median of the data set is (Round to three decimal places as needed.)arrow_forwardMean is advantageous than the median because a. It is not influenced by extreme values b. Data needs to be sorted out c. It does not consider all values d. It considers all values in a dataarrow_forward
- The table on the right gives the annual income for eight families, in thousands of dollars. Find the number of standard deviations family E's income is from the mean. Family A B C D E F G H Income 46 50 46 47 48 47 44 48 Question content area bottom Part 1 How many standard deviations is family E's income from the mean? enter your response here (Round to three decimal places as needed.)arrow_forwardIdentify the line most likely to graphically represent the mean, median and mode of the distribution? Explain how you know. А: B: С: C A Barrow_forwardA fitness instructor measured the heart rates of the participants in a yoga class at the conclusion of the class. The data is summarized in the histogram below. There were fifteen people who participated in the class between the ages of 25 and 45. 90 100 110 120 130 140 150 160 Beats per minute (bpm) What percent of the participants had a heart rate between 130 and 150 bpm? 4. 2. Frequencyarrow_forward
- Find the mean and standard deviation for the individualized instruction scores. Scores Individualized Instruction 50 - 59 4 60 – 69 8 70 - 79 6 80 - 89 8 90 - 99 3 Mean = (Round to the nearest hundredth.)arrow_forwardThe data below represents the number of T-shirts sold per week by a student who started his own online T-shirt business. Find the mean number of T-shirts sold per week. (Round your answer to the nearest tenth if necessary.) T-Shirts Sold per Week Frequency 4 3 8 2 12 4 16 6arrow_forwardCalculate the average (mean) of the data shown, to two decimal places x 7.1, 11.1, 24, 15.4 ,3.4, 13.2, 20.1, 21.6arrow_forward
arrow_back_ios
arrow_forward_ios
Recommended textbooks for you
 MATLAB: An Introduction with ApplicationsStatisticsISBN:9781119256830Author:Amos GilatPublisher:John Wiley & Sons Inc
 Probability and Statistics for Engineering and th...StatisticsISBN:9781305251809Author:Jay L. DevorePublisher:Cengage Learning
 Statistics for The Behavioral Sciences (MindTap C...StatisticsISBN:9781305504912Author:Frederick J Gravetter, Larry B. WallnauPublisher:Cengage Learning
 Elementary Statistics: Picturing the World (7th E...StatisticsISBN:9780134683416Author:Ron Larson, Betsy FarberPublisher:PEARSON
 The Basic Practice of StatisticsStatisticsISBN:9781319042578Author:David S. Moore, William I. Notz, Michael A. FlignerPublisher:W. H. Freeman
 Introduction to the Practice of StatisticsStatisticsISBN:9781319013387Author:David S. Moore, George P. McCabe, Bruce A. CraigPublisher:W. H. Freeman

MATLAB: An Introduction with Applications
Statistics
ISBN:9781119256830
Author:Amos Gilat
Publisher:John Wiley & Sons Inc

Probability and Statistics for Engineering and th...
Statistics
ISBN:9781305251809
Author:Jay L. Devore
Publisher:Cengage Learning

Statistics for The Behavioral Sciences (MindTap C...
Statistics
ISBN:9781305504912
Author:Frederick J Gravetter, Larry B. Wallnau
Publisher:Cengage Learning

Elementary Statistics: Picturing the World (7th E...
Statistics
ISBN:9780134683416
Author:Ron Larson, Betsy Farber
Publisher:PEARSON

The Basic Practice of Statistics
Statistics
ISBN:9781319042578
Author:David S. Moore, William I. Notz, Michael A. Fligner
Publisher:W. H. Freeman

Introduction to the Practice of Statistics
Statistics
ISBN:9781319013387
Author:David S. Moore, George P. McCabe, Bruce A. Craig
Publisher:W. H. Freeman