
MATLAB: An Introduction with Applications
6th Edition
ISBN: 9781119256830
Author: Amos Gilat
Publisher: John Wiley & Sons Inc
expand_more
expand_more
format_list_bulleted
Related questions
Concept explainers
Topic Video
Question
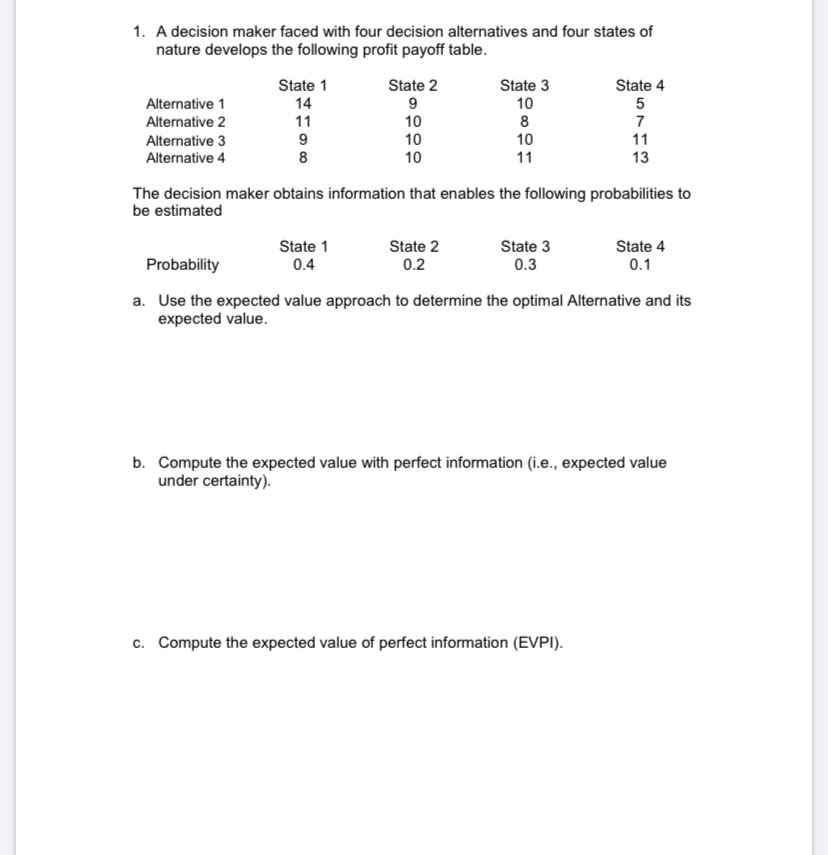

Transcribed Image Text:1. A decision maker faced with four decision alternatives and four states of
nature develops the following profit payoff table.
State 1
State 3
State 2
9
10
8
10
State 4
5
7
11
13
14
11
Alternative 1
10
10
10
Alternative 2
9
8
Alternative 3
Alternative 4
11
The decision maker obtains information that enables the following probabilities to
be estimated
State 1
0.4
State 2
0.2
State 3
0.3
State 4
0.1
Probability
a. Use the expected value approach to determine the optimal Alternative and its
expected value.
b. Compute the expected value with perfect information (i.e., expected value
under certainty).
c. Compute the expected value of perfect information (EVPI).
Expert Solution
This question has been solved!
Explore an expertly crafted, step-by-step solution for a thorough understanding of key concepts.

This is a popular solution

Trending nowThis is a popular solution!

Step by stepSolved in 2 steps

Knowledge Booster


Learn more about
Need a deep-dive on the concept behind this application? Look no further. Learn more about this topic, statistics and related others by exploring similar questions and additional content below.Similar questions
- 4 For estimating one proportion, when would you typically choose the bootstrap confidence interval over a classical (mathematical) confidence interval? O You don't have the required ten successes and ten failures. O You don't have a random sample. O You don't have a sample of size 30.arrow_forwardThe data for this exercise was obtained from https://www.currentresults.com/Weather/Florida/yearly-florida-rainfall.php 2 . Tourists often hear about the wonderful, warm Florida weather; they live in blissful ignorance of the freezes experienced in the northern parts of the state. A tourism organization wants to open up the entire state to tourists. They know that not everyone is drawn to hot, sunny beaches, so they want to advertise the advantages of visiting other parts of the state. One of the first things they need to do is educate potential tourists about the weather. And part of that involves informing them about the average rainfall across the state. Your task is to help the tourism organization figure out what the average rainfall in Florida is like. Rainfall data is provided below. The table below gives the typical yearly rainfall in some parts of Florida. Place Rainfall (inches per year) Monticello 56.8 Niceville 71.0 Tampa 46.3 Lakeland 54.8 St. Augustine Lake City 49.0 52.6…arrow_forwardLet p equal the proportion of triathletes who suffered a training-related overuse injury during the past year. Out of 330 triathletes who responded to a survey, 167 indicated that they had suffered such an injury during the past year. a) Use these data to give a point estimate of p. b)Use these data to find a 90% confidence interval for p. c) Do you think that the 330 triathletes who responded to the survey may be considered a random sample from the population of triathletes?arrow_forward
- If a confidence interval is __________, this means the point estimate is not directly in the center of the interval. A. two-sided B. symmetric C. non-symmetric D. inferentialarrow_forwardA) State the hypothesis for this test B) construct a 95 % confidence interval about the sample mean of stocks traded in 2014 C) will the researcher reject the null hypothesisarrow_forward5 A genetic experiment with peas resulted in one sample of offspring that consisted of 432 green peas and 151 yellow peas. a. Construct a 90% confidence interval to estimate of the percentage of yellow peas. b. Based on the confidence interval, do the results of the experiment appear to contradict the expectation that 25% of the offspring peas would be yellow? iew an example W S a. Construct a 90% confidence interval. Express the percentages in decimal form.arrow_forward
- A box model is used to calculate a confidence interval in the following scenario: A institution selects 300 households in a town asking about their annual income. They want to construct a confidence interval for the percentage of people having income more than $100,000 annually. For each of the following quantities in the box model, select the answer if the quantity is random, not fixed. Leave the quantities that are fixed unselected. O the EV and SE of the sample percentage of households having income more than $100. 000 annually O the population percentage of households having income more than $100,000 annually O the sample percentage of households having income more than $100,000 annually O the proportion of 1's in the box modelarrow_forwardWhich option below contains things that do not ALL match each other? a. p<α, Reject H0, Conclude treatment works b. p>α, test value inside confidence interval, Fail to Reject H0 c. p<α, test value inside confidence interval, Reject H0 d. p>α, Fail to Reject H0, Conclude treatment does NOT workarrow_forward1) A coffee shop claims that it takes 115 seconds, on average, to serve their customers coffee through their drive-thru. Lucy, a statistics student, decides to test this claim. She randomly selects 15 orders and records the wait time it took for the customer to receive their coffee. Here are the times (in seconds). 85 122 135 100 153 153 116 99 65 130 175 113 188 142 134 a) Lucy wants to make a confidence interval to estimate the true mean wait time. Explain thoroughly why Lucy has or has not satisfied the “normal” condition for constructing a confidence interval. interval b) The 95% confidence interval that Lucy constructs is 109.1 to 145.6 seconds. Does the interval provide convincing evidence that the coffee shop is lying about their claim?arrow_forward
- 56 2.) What does the confidence interval suggest about farmer Joe's claim that type 1 seed is better than type 2 seed? A. Because the confidence interval only includes positive values and does not includes positive values and does not include zero, there is sufficient evidence to support farmer Joe's claim. B. Because the confidence interval includes zero, there is sufficient evidence to support farmer Joe's claim. C. Because the confidence interval only includes positive values and does not include positive values and does not include zero, there is not sufficient evidence to support farmer Joe's claim. D. Because the confidence interval includes zero, there is not sufficient evidence to support farmer Joe's claim.arrow_forwardEspañol A researcher wants to estimate the proportion of depressed individuals taking a new anti-depressant drug who find relief. A random sample of 250 individuals who had been taking the drug is questioned; 202 of them found relief from depression. Based upon this, compute a 95% confidence interval for the proportion of all depressed individuals taking the drug who find relief. Then find the lower limit and upper limit of the 95% confidence interval. Carry your intermediate computations to at least three decimal places. Round your answers to two decimal places. (If necessary, consult a list of formulas.) Lower limit: Upper limit:arrow_forward
arrow_back_ios
arrow_forward_ios
Recommended textbooks for you
- MATLAB: An Introduction with ApplicationsStatisticsISBN:9781119256830Author:Amos GilatPublisher:John Wiley & Sons Inc
 Probability and Statistics for Engineering and th...StatisticsISBN:9781305251809Author:Jay L. DevorePublisher:Cengage Learning
 Statistics for The Behavioral Sciences (MindTap C...StatisticsISBN:9781305504912Author:Frederick J Gravetter, Larry B. WallnauPublisher:Cengage Learning
  Elementary Statistics: Picturing the World (7th E...StatisticsISBN:9780134683416Author:Ron Larson, Betsy FarberPublisher:PEARSON
 The Basic Practice of StatisticsStatisticsISBN:9781319042578Author:David S. Moore, William I. Notz, Michael A. FlignerPublisher:W. H. Freeman
 Introduction to the Practice of StatisticsStatisticsISBN:9781319013387Author:David S. Moore, George P. McCabe, Bruce A. CraigPublisher:W. H. Freeman
MATLAB: An Introduction with Applications
Statistics
ISBN:9781119256830
Author:Amos Gilat
Publisher:John Wiley & Sons Inc
Probability and Statistics for Engineering and th...
Statistics
ISBN:9781305251809
Author:Jay L. Devore
Publisher:Cengage Learning
Statistics for The Behavioral Sciences (MindTap C...
Statistics
ISBN:9781305504912
Author:Frederick J Gravetter, Larry B. Wallnau
Publisher:Cengage Learning
Elementary Statistics: Picturing the World (7th E...
Statistics
ISBN:9780134683416
Author:Ron Larson, Betsy Farber
Publisher:PEARSON
The Basic Practice of Statistics
Statistics
ISBN:9781319042578
Author:David S. Moore, William I. Notz, Michael A. Fligner
Publisher:W. H. Freeman
Introduction to the Practice of Statistics
Statistics
ISBN:9781319013387
Author:David S. Moore, George P. McCabe, Bruce A. Craig
Publisher:W. H. Freeman