
MATLAB: An Introduction with Applications
6th Edition
ISBN: 9781119256830
Author: Amos Gilat
Publisher: John Wiley & Sons Inc
expand_more
expand_more
format_list_bulleted
Related questions
Question
The final exam score was recorded for each Harper statistics student in a sample of 30. A 95% confidence interval for
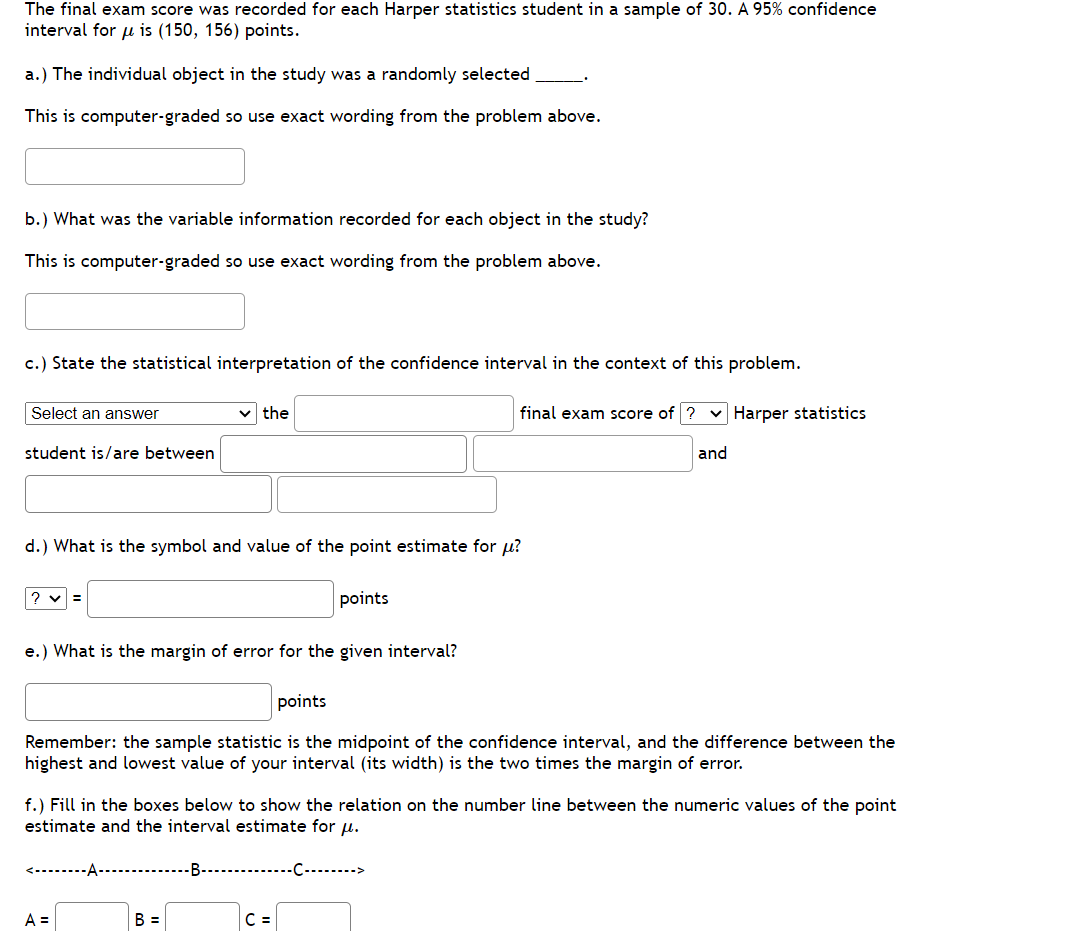

Transcribed Image Text:The final exam score was recorded for each Harper statistics student in a sample of 30. A 95% confidence
interval for u is (150, 156) points.
a.) The individual object in the study was a randomly selected
This is computer-graded so use exact wording from the problem above.
b.) What was the variable information recorded for each object in the study?
This is computer-graded so use exact wording from the problem above.
c.) State the statistical interpretation of the confidence interval in the context of this problem.
Select an answer
student is/are between
?v=
d.) What is the symbol and value of the point estimate for u?
the
e.) What is the margin of error for the given interval?
<--------A-
A =
points
points
Remember: the sample statistic is the midpoint of the confidence interval, and the difference between the
highest and lowest value of your interval (its width) is the two times the margin of error.
B =
f.) Fill in the boxes below to show the relation on the number line between the numeric values of the point
estimate and the interval estimate for μ.
final exam score of ? Harper statistics
-B-C->
C =
and
Expert Solution
This question has been solved!
Explore an expertly crafted, step-by-step solution for a thorough understanding of key concepts.

Step by stepSolved in 3 steps with 13 images

Knowledge Booster

Similar questions
- In a survey, 14 people were asked how much they spent on their child's last birthday gift. The results were roughly bell-shaped with a mean of $34 and standard deviation of $11. Construct a confidence interval at a 80% confidence level.Give your answers to one decimal place.arrow_forwardIf 64% of a sample of 550 people leaving a shopping mall claims to have spent over $25 create and interpret a 95% confidence interval estimate for the proportion of shopping mall customers who spend over $25arrow_forwardIn a survey, 14 people were asked how much they spent on their child's last birthday gift. The results were roughly bell-shaped with a mean of $32 and standard deviation of $20. Construct a confidence interval at a 80% confidence level.arrow_forward
- Which of the common confidence levels (90%, 95%, or 99%) would you prefer to use if you wanted to have the smallest confidence interval?arrow_forwardIn a survey, 21 people were asked how much they spent on their child's last birthday gift. The results were roughly bell-shaped with a mean of $46 and standard deviation of $15. Construct a confidence interval at a 90% confidence level.Give your answers to one decimal place.arrow_forwarda. 14.0, 16.3, 18.7, 19.9, 21.3 b. 16.1, 13.4, 13.6, 14.9, 14.1, 10.5 Construct the 95% confidence interval for the difference in u of the two given samples.arrow_forward
- In a survey, 22 people were asked how much they spent on their child's last birthday gift. The results were roughly bell-shaped with a mean of $38 and standard deviation of $4. Construct a confidence interval at a 90% confidence level.arrow_forwardIn a survey, 24 people were asked how much they spent on their child's last birthday gift. The results were roughly bell-shaped with a mean of $36 and standard deviation of $15. Construct a confidence interval at a 90% confidence level.arrow_forwardin a survey, 27 people were asked how much they spent on their child's last birthday gift. the results were roughly bell-shaped with a mean of $30 and sample standard deviation of $20. construct a confidence interval at a 95% confidence level.arrow_forward
- See attachmentarrow_forwarda. interpret the corresponding 95% confidence intervals for both Birth weight and Age. b. What is the predicted average SBP of an infant born with birth weight 8lbs (128oz) measured at 3 days old? c. Calculate the Pearson correlation between Age and Birth weight, and test if this correlation is significant at the 0.05 level. Does this answer surprise you, why or why not?arrow_forwardIn a survey, 26 people were asked how much they spent on their child's last birthday gift. The results were roughly bell-shaped with a mean of $33 and standard deviation of $14. Construct a confidence interval at a 90% confidence level.arrow_forward
arrow_back_ios
SEE MORE QUESTIONS
arrow_forward_ios
Recommended textbooks for you
- MATLAB: An Introduction with ApplicationsStatisticsISBN:9781119256830Author:Amos GilatPublisher:John Wiley & Sons Inc
 Probability and Statistics for Engineering and th...StatisticsISBN:9781305251809Author:Jay L. DevorePublisher:Cengage Learning
 Statistics for The Behavioral Sciences (MindTap C...StatisticsISBN:9781305504912Author:Frederick J Gravetter, Larry B. WallnauPublisher:Cengage Learning
  Elementary Statistics: Picturing the World (7th E...StatisticsISBN:9780134683416Author:Ron Larson, Betsy FarberPublisher:PEARSON
 The Basic Practice of StatisticsStatisticsISBN:9781319042578Author:David S. Moore, William I. Notz, Michael A. FlignerPublisher:W. H. Freeman
 Introduction to the Practice of StatisticsStatisticsISBN:9781319013387Author:David S. Moore, George P. McCabe, Bruce A. CraigPublisher:W. H. Freeman
MATLAB: An Introduction with Applications
Statistics
ISBN:9781119256830
Author:Amos Gilat
Publisher:John Wiley & Sons Inc
Probability and Statistics for Engineering and th...
Statistics
ISBN:9781305251809
Author:Jay L. Devore
Publisher:Cengage Learning
Statistics for The Behavioral Sciences (MindTap C...
Statistics
ISBN:9781305504912
Author:Frederick J Gravetter, Larry B. Wallnau
Publisher:Cengage Learning
Elementary Statistics: Picturing the World (7th E...
Statistics
ISBN:9780134683416
Author:Ron Larson, Betsy Farber
Publisher:PEARSON
The Basic Practice of Statistics
Statistics
ISBN:9781319042578
Author:David S. Moore, William I. Notz, Michael A. Fligner
Publisher:W. H. Freeman
Introduction to the Practice of Statistics
Statistics
ISBN:9781319013387
Author:David S. Moore, George P. McCabe, Bruce A. Craig
Publisher:W. H. Freeman