Related questions
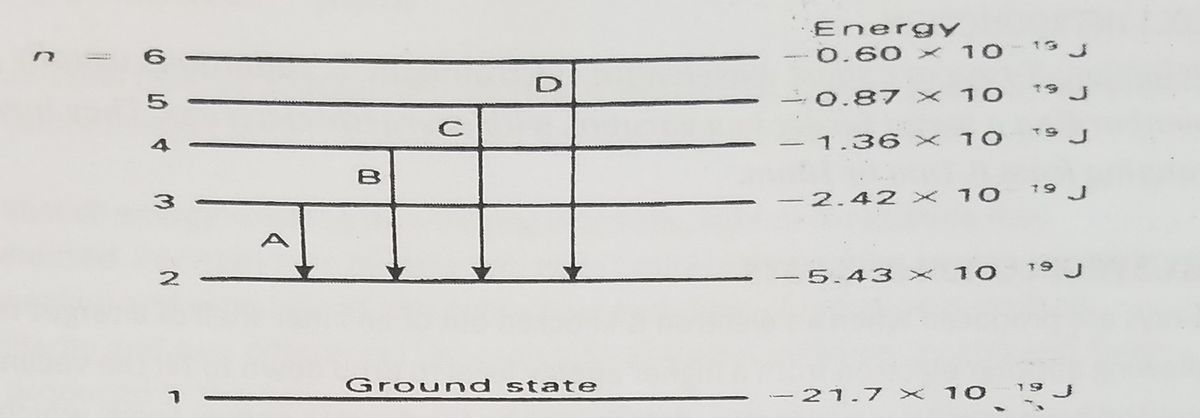
(a.) The figure below representing the lowest energy levels of the electron in the hydrogen atom, gives the principal quantum number n associated with each, and the corresponding value of the energy, measured in joules.
(i.) Calculate the wavelength of the lines arising from the transitions márk A, B, C, D on the figure.
(ii.) Show that the other transitions that can occur give rise to lines which are in either the ultraviolet or the infrared regions of the spectrum.
(iii.) The level n = 1 is the ground state of the excited hydrogen atom. Explain why hydrogen in its ground state is quite transparent to light emitted by the transition A, B, C, D and also what happens when 21.7 × 10⁻¹⁹ J of energy is supplied to a hydrogen atom in its ground state.


Step by stepSolved in 3 steps with 1 images


- (2.13) Selection rules in hydrogen Hydrogen atoms are excited (by a pulse of laser light that drives a multi-photon process) to a spe- cific configuration and the subsequent spontaneous emission is resolved using a spectrograph. Infra- red and visible spectral lines are detected only at the wavelengths 4.05 um, 1.87 µm and 0.656 µm. Explain these observations and give the values of n and l for the configurations involved in these transitions.arrow_forwardPlease Solve the problem question quantum physics.... With the step, thank uarrow_forwardNeeds Complete solution with 100 % accuracy don't use chat gpt or ai.arrow_forward
- Use the Balmer's equation to Calculate wavelengths for transitions starting with states n; = 3 and 4, nf = 2 ending. What part of the electromagnetic spectrum do these wavelengths belong to? Where Rydberg's constant is R = 1.097x10⁷ m².arrow_forwardThe л-electrons can flow freely across the conjugated system of a 1,3-butadiene The total length that the π-electrons can travel is 1.47 Å. H H 1 LH HTC H H What is the energy (J) required to promote an electron from the HOMO(highest occupied energy level) to the LUMO(highest unoccupied energy level)? [each C contributes one e] What wavelength of light does this correspond to?arrow_forward