
A First Course in Probability (10th Edition)
10th Edition
ISBN: 9780134753119
Author: Sheldon Ross
Publisher: PEARSON
expand_more
expand_more
format_list_bulleted
Related questions
Question
Q 3

Transcribed Image Text:### CBS News Poll on Party Affiliation and Economic Opinion
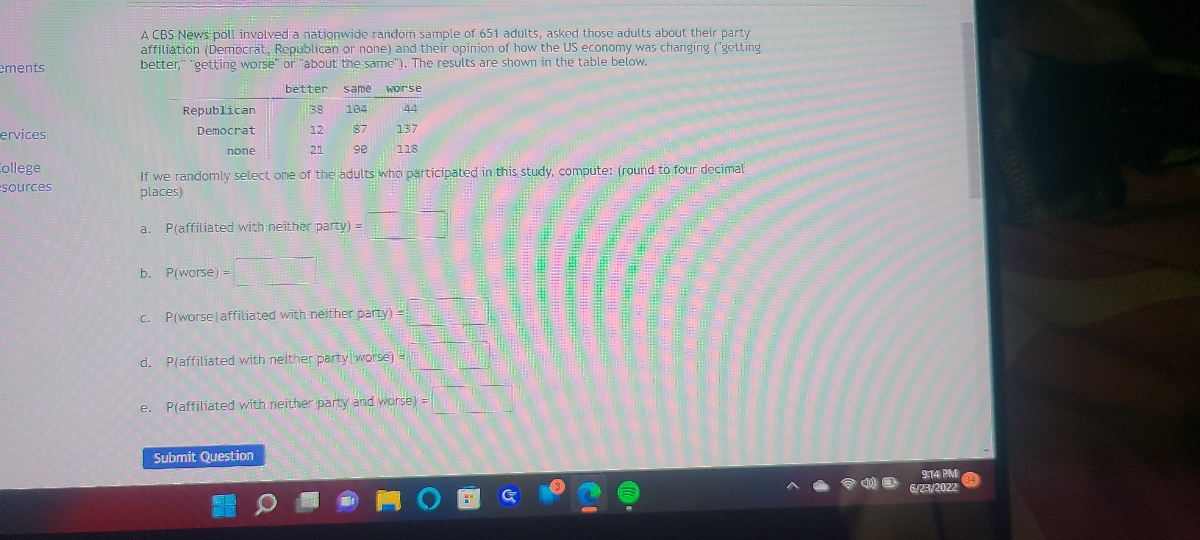
A CBS News poll involved a nationwide random sample of 651 adults. These adults were asked about their party affiliation (Democrat, Republican, or none) and their opinion on how the US economy was changing ("getting better", "getting worse", or "about the same"). The results are summarized in the table below:
| | better | same | worse |
|----------------------|--------|------|-------|
| Republican | 38 | 104 | 44 |
| Democrat | 12 | 87 | 137 |
| none | 20 | 90 | 118 |
If we randomly select one of the adults who participated in this study, compute the following probabilities (rounded to four decimal places):
a. **P(affiliated with neither party) =**
b. **P(worse) =**
c. **P(worse affiliated with neither party) =**
d. **P(affiliated with neither party | worse) =**
e. **P(affiliated with neither party and worse) =**
**Instructions for Calculation:**
1. **Determine individual probabilities** from the data provided.
2. **P(affiliated with neither party)**: Calculate the probability that a randomly selected person is not affiliated with either major party.
3. **P(worse)**: Calculate the probability that a randomly selected person believes the economy is getting worse.
4. **P(worse affiliated with neither party)**: Determine the probability that a person not affiliated with any party believes the economy is getting worse.
5. **P(affiliated with neither party | worse)**: The probability that a person is not affiliated with either party given that they believe the economy is getting worse.
6. **P(affiliated with neither party and worse)**: The probability that a person is both not affiliated with any party and believes the economy is getting worse.
This table reflects the intersection of opinions and party affiliations to facilitate understanding of the economic sentiment in relation to political adherence.
Expert Solution
This question has been solved!
Explore an expertly crafted, step-by-step solution for a thorough understanding of key concepts.

This is a popular solution

Trending nowThis is a popular solution!

Step by stepSolved in 2 steps

Knowledge Booster

Similar questions
arrow_back_ios
arrow_forward_ios
Recommended textbooks for you
- A First Course in Probability (10th Edition)ProbabilityISBN:9780134753119Author:Sheldon RossPublisher:PEARSON

A First Course in Probability (10th Edition)
Probability
ISBN:9780134753119
Author:Sheldon Ross
Publisher:PEARSON