MATLAB: An Introduction with Applications
6th Edition
ISBN: 9781119256830
Author: Amos Gilat
Publisher: John Wiley & Sons Inc
expand_more
expand_more
format_list_bulleted
Question

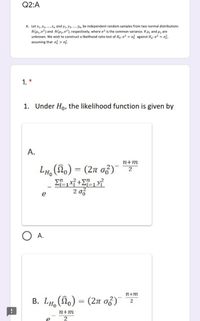
Transcribed Image Text:Q2:A
A. Let x1, X2, .,Xn and y1, y2, ., Ym be independent random samples from two normal distributions
N(H1,02) and N(H2,02), respectively, where o? is the common variance. If µ, and u2 are
unknown. We wish to construct a likelihood ratio test of Ho:o? = o? against H,: o? = o%,
assuming that o? > ož.
1. *
1. Under Ho, the likelihood function is given by
A.
n+m
LH, (no) = (2n of)
%3D
2 of
e
O A.
2+m
B. LH, (o) = (2n o3)
n+m
Expert Solution
This question has been solved!
Explore an expertly crafted, step-by-step solution for a thorough understanding of key concepts.
This is a popular solution
Trending nowThis is a popular solution!
Step by stepSolved in 2 steps

Knowledge Booster
Similar questions
- Do a two-sample test for equality of means assuming unequal variances. Calculate the p-value using Excel. (a-1) Comparison of GPA for randomly chosen college juniors and seniors: x⎯⎯1x¯1 = 4.5, s1 = .20, n1 = 15, x⎯⎯2x¯2 = 4.9, s2 = .30, n2 = 15, α = .025, left-tailed test.(Negative values should be indicated by a minus sign. Round down your d.f. answer to the nearest whole number and other answers to 4 decimal places. Do not use "quick" rules for degrees of freedom.) d.f. Not attempted t-calculated Not attempted p-value Not attempted t-critical Not attempted (a-2) Based on the above data choose the correct decision. Do not reject the null hypothesis Reject the null hypothesisarrow_forwardThe results of a state mathematics test for random samples of students taught by two different teachers at the same school are shown below. Can you conclude there is a difference in the mean mathematics test scores for the students of the two teachers? Use α = 0.01. In addition, assume the populations are normally distributed and the population variances/standard deviations are not equal. Teacher 1 Teacher 2 ?̅1 = 473 ?̅2 = 459 S1 = 39.7 S2 = 24.5 n 1 = 8 n 2 = 18 a. State the null and alternate hypotheses (write it mathematically) and write your claim. b. Find the test statistic c. Identify the Rejection region (critical region) and fail to reject region. Show this by drawing a curve and…arrow_forwardPlease note the question is: What is the distribution of the t-test statistic if m, n -----> ∞ ?arrow_forward
- A study tested the claim that heights of Americans and heights of Austrians have different variances with s=7.48092 cm for Americans and 7.14756 cm for Austrians. The sample sizes are n1= 145 and n2= 157. When using the F test with these data, is it correct to reason that there is no need to check for normalcy because n1 is greater than 30, and n2 is greater than 30?arrow_forwardcan you please provide explanationsarrow_forwardThe mean age of 31 slot mechanic player is 51.3 years, and the standard deviation is 6.8 years.the mean age of a different sample of 35 roulette player is 54.8 year and standard deviation is 3.2 years. Can it be concluded at alpha = 0.01 that the mean age of slot machine players is less than those players roulette? Assume the variance are equal Step 1= Step 2= Step 3= Step 4=arrow_forward
- 1. Six batteries taken at random from a large lot were subjected to life tests with the following results: 19, 22, 18, 16, 25, and 20 hours. Find the probability that the sample mean of x= 20 hours, as observed here, or one less than 20 hours could arise if the true mean of the lot of batteries is 21.5 hours, assuming a known variance of o = 10 hours, for the individual batteries in the lot. %3Darrow_forwardCompute the standard score (Z-score) for x, when x = 21, the mean of the distribution = 27, and the variance (S2) = 9. Z = %3D O 2 -2 .67 -.67arrow_forwardA sample with SS=30 and a variance of s2 =10 has n=4 scores. True or False?arrow_forward
arrow_back_ios
arrow_forward_ios
Recommended textbooks for you
 MATLAB: An Introduction with ApplicationsStatisticsISBN:9781119256830Author:Amos GilatPublisher:John Wiley & Sons Inc
 Probability and Statistics for Engineering and th...StatisticsISBN:9781305251809Author:Jay L. DevorePublisher:Cengage Learning
 Statistics for The Behavioral Sciences (MindTap C...StatisticsISBN:9781305504912Author:Frederick J Gravetter, Larry B. WallnauPublisher:Cengage Learning
 Elementary Statistics: Picturing the World (7th E...StatisticsISBN:9780134683416Author:Ron Larson, Betsy FarberPublisher:PEARSON
 The Basic Practice of StatisticsStatisticsISBN:9781319042578Author:David S. Moore, William I. Notz, Michael A. FlignerPublisher:W. H. Freeman
 Introduction to the Practice of StatisticsStatisticsISBN:9781319013387Author:David S. Moore, George P. McCabe, Bruce A. CraigPublisher:W. H. Freeman

MATLAB: An Introduction with Applications
Statistics
ISBN:9781119256830
Author:Amos Gilat
Publisher:John Wiley & Sons Inc

Probability and Statistics for Engineering and th...
Statistics
ISBN:9781305251809
Author:Jay L. Devore
Publisher:Cengage Learning

Statistics for The Behavioral Sciences (MindTap C...
Statistics
ISBN:9781305504912
Author:Frederick J Gravetter, Larry B. Wallnau
Publisher:Cengage Learning

Elementary Statistics: Picturing the World (7th E...
Statistics
ISBN:9780134683416
Author:Ron Larson, Betsy Farber
Publisher:PEARSON

The Basic Practice of Statistics
Statistics
ISBN:9781319042578
Author:David S. Moore, William I. Notz, Michael A. Fligner
Publisher:W. H. Freeman

Introduction to the Practice of Statistics
Statistics
ISBN:9781319013387
Author:David S. Moore, George P. McCabe, Bruce A. Craig
Publisher:W. H. Freeman