
MATLAB: An Introduction with Applications
6th Edition
ISBN: 9781119256830
Author: Amos Gilat
Publisher: John Wiley & Sons Inc
expand_more
expand_more
format_list_bulleted
Related questions
Question
a. Determine the sample proportions.
Determine the sample proportion
p1.
p1=enter your response here
(Round to three decimal places as needed.)Part 2
Determine the sample proportion
p2.
p2=enter your response here
(Round to three decimal places as needed.)Part 3
Determine the pooled sample proportion
pp.
pp=enter your response here
(Round to three decimal places as needed.)Part 4
b. Decide whether using the two-proportions z-procedures is appropriate.
Check that the assumptions are satisfied. Select all that apply.
The assumptions are satisfied, so using the procedures is appropriate.
Since
x1
is less than 5, using the procedures is not appropriate.Since
n2−x2
is less than 5, using the procedures is not appropriate.Since
x2
is less than 5, using the procedures is not appropriate.Since
n1−x1
is less than 5, using the procedures is not appropriate.Part 5
c. If appropriate, use the two-proportions z-test to conduct the required hypothesis test. What are the hypotheses for this test?
H0: p1=p2, Ha: p1≠p2
H0: p1=p2, Ha: p1<p2
H0: p1<p2, Ha: p1=p2
H0: p1≠p2, Ha: p1=p2
H0: p1=p2, Ha: p1>p2
H0: p1>p2, Ha: p1=p2
Using the two-proportions z-procedures is not appropriate.
Part 6
Determine the test statistic, if appropriate. Select the correct choice below and, if necessary, fill in the answer box to complete your answer.
z=enter your response here
(Round to two decimal places as needed.)Using the two-proportions z-procedures is not appropriate.
Part 7
Identify the P-value, if appropriate. Select the correct choice below and, if necessary, fill in the answer box to complete your answer.
The P-value is
enter your response here.
(Round to three decimal places as needed.)
Using the two-proportions z-procedures is not appropriate.
Part 8
Which of the following is the correct conclusion for the hypothesis test?
At the 5% significance level,
do not reject
H0;
the data
provide
sufficient evidence to accept
Ha.
At the 5% significance level,
reject
H0;
the data
provide
sufficient evidence to accept
Ha.
At the 5% significance level,
do not reject
H0;
the data
do not provide
sufficient evidence to accept
Ha.
At the 5% significance level,
reject
H0;
the data
do not provide
sufficient evidence to accept
Ha.
Using the two-proportions z-procedures is not appropriate.
d. If appropriate, use the two-proportions z-interval procedure to find the specified confidence interval.
Select the correct choice below and, if necessary, fill in the answer boxes to complete your answer.
The 90% confidence interval for
p1−p2
is from
enter your response here
to
enter your response here.
(Round to three decimal places as needed.)
Using the two-proportions z-procedures is not appropriate.
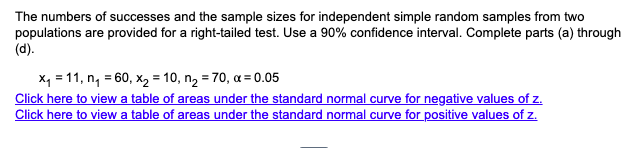

Transcribed Image Text:The numbers of successes and the sample sizes for independent simple random samples from two
populations are provided for a right-tailed test. Use a 90% confidence interval. Complete parts (a) through
(d).
x₁ = 11, n₁ = 60, x₂ = 10, n₂ = 70, x=0.05
Click here to view a table of areas under the standard normal curve for negative values of z.
Click here to view a table of areas under the standard normal curve for positive values of z.
Expert Solution
This question has been solved!
Explore an expertly crafted, step-by-step solution for a thorough understanding of key concepts.

Step by stepSolved in 2 steps

Knowledge Booster

Similar questions
- B Identify the sample proportion and use the symbol that represents it C. For the hypothesis test, identify the value used for the population proportion and use the symbol that represents it.arrow_forwardYou are the operations manager for an airline and you are considering a higher fare level for passengers in aisle seats. How many randomly selected air passengers must you survey? Assume that you want to be 99% confident that the sample percentage is within 1.5 percentage points of the true population percentage. Complete parts (a) and (b) below. a. Assume that nothing is known about the percentage of passengers who prefer aisle seats. n= (Round up to the nearest integer.) B- Assume that a prior survey suggests that about 38% of air passengers prefer an aisle seat. n = (Round up to the nearest integer.)arrow_forward7.2.29-T Question Help An IQ test is designed so that the mean is 100 and the standard deviation is 19 for the population of normal adults. Find the sample size necessary to estimate the mean IQ score of statistics students such that it can be said with 99% confidence that the sample mean is within 6 IQ points of the true mean. Assume that o = 19 and determine the required sample size using technology. Then determine if this is a reasonable sample size for a real world calculation. The required sample size is. (Round up to the nearest integer.)arrow_forward
- You are the operations manager for an airline and you are considering a higher fare level for passengers in aisle seats. How many randomly selected air passengers must you survey? Assume that you want to be 95% confident that the sample percentage is within 5.5 percentage points of the true population percentage. Complete parts (a) and (b) below. a. Assume that nothing is known about the percentage of passengers who prefer aisle seats. n = (Round up to the nearest integer.) b. Assume that a prior survey suggests that about 34% of air passengers prefer an aisle seat. n = IDound un to the nearest integer)arrow_forwardDescribe the sampling distribution of p. Round to three decimal places when necessary. N=22,000, n=400, p=0.3arrow_forwardKnowing that you need a sample pool of 536 students to ultimately get about 250 students in your sample, you are in position to draw a systematic sample from the student directory at your university. Further, 5,000 students are listed in the directory. What is the sampling interval?arrow_forward
arrow_back_ios
arrow_forward_ios
Recommended textbooks for you
- MATLAB: An Introduction with ApplicationsStatisticsISBN:9781119256830Author:Amos GilatPublisher:John Wiley & Sons Inc
 Probability and Statistics for Engineering and th...StatisticsISBN:9781305251809Author:Jay L. DevorePublisher:Cengage Learning
 Statistics for The Behavioral Sciences (MindTap C...StatisticsISBN:9781305504912Author:Frederick J Gravetter, Larry B. WallnauPublisher:Cengage Learning
  Elementary Statistics: Picturing the World (7th E...StatisticsISBN:9780134683416Author:Ron Larson, Betsy FarberPublisher:PEARSON
 The Basic Practice of StatisticsStatisticsISBN:9781319042578Author:David S. Moore, William I. Notz, Michael A. FlignerPublisher:W. H. Freeman
 Introduction to the Practice of StatisticsStatisticsISBN:9781319013387Author:David S. Moore, George P. McCabe, Bruce A. CraigPublisher:W. H. Freeman
MATLAB: An Introduction with Applications
Statistics
ISBN:9781119256830
Author:Amos Gilat
Publisher:John Wiley & Sons Inc
Probability and Statistics for Engineering and th...
Statistics
ISBN:9781305251809
Author:Jay L. Devore
Publisher:Cengage Learning
Statistics for The Behavioral Sciences (MindTap C...
Statistics
ISBN:9781305504912
Author:Frederick J Gravetter, Larry B. Wallnau
Publisher:Cengage Learning
Elementary Statistics: Picturing the World (7th E...
Statistics
ISBN:9780134683416
Author:Ron Larson, Betsy Farber
Publisher:PEARSON
The Basic Practice of Statistics
Statistics
ISBN:9781319042578
Author:David S. Moore, William I. Notz, Michael A. Fligner
Publisher:W. H. Freeman
Introduction to the Practice of Statistics
Statistics
ISBN:9781319013387
Author:David S. Moore, George P. McCabe, Bruce A. Craig
Publisher:W. H. Freeman