MATLAB: An Introduction with Applications
6th Edition
ISBN: 9781119256830
Author: Amos Gilat
Publisher: John Wiley & Sons Inc
expand_more
expand_more
format_list_bulleted
Question
Question in 1st image.
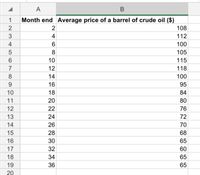
Refer to data in 2nd image.

Transcribed Image Text:a. Determine the best fit curve for the data. Show the equation representing the best fit curve and the coefficient of
determination (R). R² shows how well the best fit curve fits the data.
b. What would likely be the average price of a barrel of crude oil in the 45" month?
c. What was the average price of a barrel of crude oil in the 23d month?

Transcribed Image Text:A
B
1
Month end Average price of a barrel of crude oil ($)
2
2
108
3
4
112
4
100
8
105
10
115
7
12
118
8
14
100
9.
16
95
10
18
84
11
20
80
12
22
76
13
24
72
14
26
70
15
28
68
16
30
65
17
32
60
18
34
65
19
36
65
20
Expert Solution
This question has been solved!
Explore an expertly crafted, step-by-step solution for a thorough understanding of key concepts.
Step by stepSolved in 2 steps

Knowledge Booster
Learn more about
Need a deep-dive on the concept behind this application? Look no further. Learn more about this topic, statistics and related others by exploring similar questions and additional content below.Similar questions
- Classify the data as either discrete or continuous.The number of freshmen entering college in a certain year is 621. Group of answer choices Discrete Continuousarrow_forward8, 9, 10, 12, 18, 22, 23, 25, 25, 27, 28, 29, 31, 39, 39, 43. Notice that the numbers are ordered from least to greatest. Make a box-and-whisker plot for the data.arrow_forwardTwenty salesmen were asked how many phone calls they made on a givan day. The data was ecorded in the table balow. Construct a dot plot for the sat. 15 12 0 1 2 3 4 5 0 1 2 3 4 5 0 1 2 3 4 5 0 1 2 34 5arrow_forward
- Please produce descriptive statistics for this data setarrow_forwardUsing the data in the first image can you give me answers to questions in 2nd image(4,5,6).Can you plz atleast explain how to do 5&6 (6 is the main one) plz help......arrow_forwardExQm Score Oata 76 69 64 75 70 80 90 86 77 79 82 96 51 64 95 6.2 76 65 68 74 Oc Mahe a box- and whiskar plot d alculus data Examarrow_forward
arrow_back_ios
arrow_forward_ios
Recommended textbooks for you
 MATLAB: An Introduction with ApplicationsStatisticsISBN:9781119256830Author:Amos GilatPublisher:John Wiley & Sons Inc
 Probability and Statistics for Engineering and th...StatisticsISBN:9781305251809Author:Jay L. DevorePublisher:Cengage Learning
 Statistics for The Behavioral Sciences (MindTap C...StatisticsISBN:9781305504912Author:Frederick J Gravetter, Larry B. WallnauPublisher:Cengage Learning
 Elementary Statistics: Picturing the World (7th E...StatisticsISBN:9780134683416Author:Ron Larson, Betsy FarberPublisher:PEARSON
 The Basic Practice of StatisticsStatisticsISBN:9781319042578Author:David S. Moore, William I. Notz, Michael A. FlignerPublisher:W. H. Freeman
 Introduction to the Practice of StatisticsStatisticsISBN:9781319013387Author:David S. Moore, George P. McCabe, Bruce A. CraigPublisher:W. H. Freeman

MATLAB: An Introduction with Applications
Statistics
ISBN:9781119256830
Author:Amos Gilat
Publisher:John Wiley & Sons Inc

Probability and Statistics for Engineering and th...
Statistics
ISBN:9781305251809
Author:Jay L. Devore
Publisher:Cengage Learning

Statistics for The Behavioral Sciences (MindTap C...
Statistics
ISBN:9781305504912
Author:Frederick J Gravetter, Larry B. Wallnau
Publisher:Cengage Learning

Elementary Statistics: Picturing the World (7th E...
Statistics
ISBN:9780134683416
Author:Ron Larson, Betsy Farber
Publisher:PEARSON

The Basic Practice of Statistics
Statistics
ISBN:9781319042578
Author:David S. Moore, William I. Notz, Michael A. Fligner
Publisher:W. H. Freeman

Introduction to the Practice of Statistics
Statistics
ISBN:9781319013387
Author:David S. Moore, George P. McCabe, Bruce A. Craig
Publisher:W. H. Freeman