MATLAB: An Introduction with Applications
6th Edition
ISBN: 9781119256830
Author: Amos Gilat
Publisher: John Wiley & Sons Inc
expand_more
expand_more
format_list_bulleted
Question
thumb_up100%

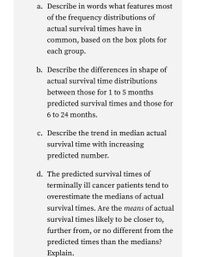
Transcribed Image Text:a. Describe in words what features most
of the frequency distributions of
actual survival times have in
common, based on the box plots for
each group.
b. Describe the differences in shape of
actual survival time distributions
between those for 1 to 5 months
predicted survival times and those for
6 to 24 months.
c. Describe the trend in median actual
survival time with increasing
predicted number.
d. The predicted survival times of
terminally ill cancer patients tend to
overestimate the medians of actual
survival times. Are the means of actual
survival times likely to be closer to,
further from, or no different from the
predicted times than the medians?
Explain.

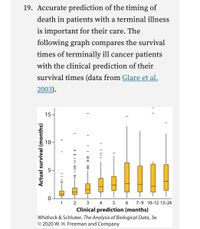
Transcribed Image Text:19. Accurate prediction of the timing of
death in patients with a terminal illness
is important for their care. The
following graph compares the survival
times of terminally ill cancer patients
with the clinical prediction of their
survival times (data from Glare et al.
2003).
15
2
3
4 5 6
7-9 10-12 13-24
Clinical prediction (months)
Whitlock & Schluter, The Analysis of Biological Data, 3e
© 2020 W. H. Freeman and Company
I I|
II III ||
5.
Actual survival (months)
Expert Solution
This question has been solved!
Explore an expertly crafted, step-by-step solution for a thorough understanding of key concepts.
This is a popular solution
Trending nowThis is a popular solution!
Step by stepSolved in 2 steps with 2 images

Knowledge Booster
Similar questions
- Can someone please help me with these?arrow_forward2. What does it mean for a scatter plot to have a negative trend? O A. Higher c-values tend to go with higher y-values. OB. Higher -values tend to go with lower y-values. OC. The x- and y-values appear to be unrelated. OD. None of these are true.arrow_forwardThis is only one questionarrow_forward
- Let the joint PDF of two RV x, y be: A, for-2≤a≤2, 0≤b≤1, fx,y (a, b) = {0, otherwise. Derive the value of constant A and calculate the probability of x and y being in the interval 0≤x≤1, 0≤ y ≤<1, respectively.arrow_forwardAnswer the following questions using the separate rates X1,..., X20 and Y1,..., Y20 shown in Figure 1. (a) Carry out the calculations for a test of the hypotheses that the mean U.S. mortality rate On remained the same or increased from 2005 to 2015 against the alternative that the mean mortality rate decreased. State the hypotheses, test statistic, rejection region, and p-value. Do not interpret the conclusion of the test. (b) Compute a 99% confidence interval for the change in mean heart rate mortality. Do not interpret the interval.arrow_forward18arrow_forward
- 8.Suppose you compare the mean of raw data and the mean of the same raw data grouped into a frequency distribution. These two means will be a. Exactly equal. b. The same as the median. c. The same as the geometric mean. d. Approximately equal.arrow_forwardWhat was the age distribution of nurses in Great Britain at the time of Florence Nightingale? Suppose we have the following information. Note: In 1851 there were 25,466 nurses in Great Britain. Age range (yr) 20-29 30-39 40-49 50-59 60-69 70-79 80+ Midpoint x 24.5 34.5 44.5 54.5 64.5 74.5 84.5 Percent of nurses 5.2% 9.5% 19.8% 29.1% 25.1% 9.4% 1.9% (a) Find the probability that a British nurse selected at random in 1851 would be 60 years of age or older. (Round your answer to three decimal places.)(b) Compute the expected age ? of a British nurse contemporary to Florence Nightingale. (Round your answer to two decimal places.) yr(c) Compute the standard deviation ? for ages of nurses shown in the distribution. (Round your answer to two decimal places.) yrarrow_forwardThis is for my data analysis class. Please answer all parts of the question.arrow_forward
arrow_back_ios
arrow_forward_ios
Recommended textbooks for you
 MATLAB: An Introduction with ApplicationsStatisticsISBN:9781119256830Author:Amos GilatPublisher:John Wiley & Sons Inc
 Probability and Statistics for Engineering and th...StatisticsISBN:9781305251809Author:Jay L. DevorePublisher:Cengage Learning
 Statistics for The Behavioral Sciences (MindTap C...StatisticsISBN:9781305504912Author:Frederick J Gravetter, Larry B. WallnauPublisher:Cengage Learning
 Elementary Statistics: Picturing the World (7th E...StatisticsISBN:9780134683416Author:Ron Larson, Betsy FarberPublisher:PEARSON
 The Basic Practice of StatisticsStatisticsISBN:9781319042578Author:David S. Moore, William I. Notz, Michael A. FlignerPublisher:W. H. Freeman
 Introduction to the Practice of StatisticsStatisticsISBN:9781319013387Author:David S. Moore, George P. McCabe, Bruce A. CraigPublisher:W. H. Freeman

MATLAB: An Introduction with Applications
Statistics
ISBN:9781119256830
Author:Amos Gilat
Publisher:John Wiley & Sons Inc

Probability and Statistics for Engineering and th...
Statistics
ISBN:9781305251809
Author:Jay L. Devore
Publisher:Cengage Learning

Statistics for The Behavioral Sciences (MindTap C...
Statistics
ISBN:9781305504912
Author:Frederick J Gravetter, Larry B. Wallnau
Publisher:Cengage Learning

Elementary Statistics: Picturing the World (7th E...
Statistics
ISBN:9780134683416
Author:Ron Larson, Betsy Farber
Publisher:PEARSON

The Basic Practice of Statistics
Statistics
ISBN:9781319042578
Author:David S. Moore, William I. Notz, Michael A. Fligner
Publisher:W. H. Freeman

Introduction to the Practice of Statistics
Statistics
ISBN:9781319013387
Author:David S. Moore, George P. McCabe, Bruce A. Craig
Publisher:W. H. Freeman