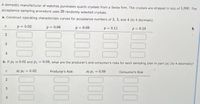
a. Construct operating characteristic curves for acceptance numbers of 2, 3, and 4 (to 4 decimals). p= 0.02 p= 0.06 p = 0.09 p = 0.11 p= 0.16 00 000 000 00 00
Q: |%9• I. 9:1V A residential building includes 60 apartments for leasing located in two floors: ground…
A:
Q: Researcher collected information about income and housing cost from 66 individuals What is R³? What…
A: Given the data on income and housing costs from 66 individuals asMedian incomeHousing…
Q: A) from the bellow table find the Mean? En=37 Classes 1-6 7-12 13-18 19-24 25-30 31-36 37-42…
A:
Q: Let p be the population proportion for the following condition. Find the point estimates for p and…
A: X = 124N = 892
Q: Use the drop-down menus to explain if the two figures below are congruent, similar, or neither. If…
A: Given Data: We have to explain the given two figures are congruent, similar or neither. If it is…
Q: Find the harmonic mean from the following: 7 10 13 15 20 25 28.
A:
Q: Use MINITAB or some other computer software toconstruct a stem-and-leaf display for the following…
A: The stem and leaf plot is obtained using EXCEL MegaStat. The software procedure is given below:…
Q: The following items represent the number of birds observed at a given feeder over the past several…
A: Arranging ins descending order 2,19,33,35,48,68,74
Q: Every year, the students at a school are given a musical aptitude test that rates them from 0 (no…
A: Given data is: Aptitude Score (x) Frequency (f) Cumulative frequency (cf) 0 0 0 1 5 5 2 4 9…
Q: A 44
A:
Q: 1. observed deaths (∑ Obs)=……………? 2. expected deaths = population rates ⅹ person-years: a)…
A: Note: Since you have posted a question with multiple sub-parts, we will solve first three sub-parts…
Q: Treatment nị A 6 5.0 10.0 B 10.0 14.0 C 6 20.0 10.0 D 6. 7.0 14.0 Test for a difference among the…
A: The given summary statistics are as follows:
Q: The following items represent the number of birds observed at a given feeder over the past several…
A:
Q: During a year the ratio of the prices of commodities A and B was 5 whereas during the next year…
A:
Q: In a student survey, sixty part-time students were asked how many courses they were taking this…
A: Solution: From the given information, total number of part-time students is 60.
Q: Let p be the population proportion for the following condition. Find the point estimates for p and…
A: Given,n=963x=114
Q: Which one of the following values can never be negative?
A: So measures of central tendency and dispersion are given and we have to determine which measure can…
Q: _____ are often referred to as measures of central tendency. a. Sums b. Ranges c. Frequencies…
A:
Q: Compute the mean of the data set. Round to the nearest hundredth. 42 142 63 37 12 96
A: Given: The given data set is 42, 142, 63, 37, 12 and 96. To find: We have to find the mean of the…
Q: The depths (in inches) at which 10 artifacts are found are listed. Complete parts (a) and (b) below.…
A: Solution
Q: was compiled. Determine the level of measurement (Nominal, Ordinal, Interval, or Ratio) for each set…
A: Here we want to know level of measurement.
Q: 6-8 6. 12 12 %3D Preview Answers Submit Answers
A:
Q: evelop a point estimate of the proportion of teens aged 13 to 17 who say social media makes them…
A: Sample size n=743
Q: Let p be the population proportion for the following condition. Find the point estimates for p and…
A: Denote p as the population proportion of children, who planned to join the armed forces in the…
Q: Consider a value to be significantly low if its z score less than or equal to -2 or consider a value…
A: Bartleby policy: Since you have asked multiple question, we will solve the first question for you.…
Q: The mean of the frequency distribution is (Type an integer or a decimal. Round to the nearest tenth…
A: The given data is as follows, Class Frequency 624 12 537 6 597 11 584 16 581 5 605 7…
Q: show that the two formulae of the geometric mean are equal?
A: From the given information, Formula for geometric mean is given by;
Q: Using the data in the table below, calculate the Incidence Proportion as a decimal for each of the…
A: Given: Week New cases of Foodborne illness Total Cases of Foodborne illness Number of people who…
Q: John records the dates of a bunch of nickels. Determine the mean date of the nickels. final answer,…
A:
Q: Compute the geometric mean of the following data : 15 10 18 20 25 :: 2 3 5 6 4
A:
Q: What is the symbol for the arithmetic average height for all males in a population.
A: Average may be defined as ratio of sum of all observation to the total number of observation.
Q: Which of the following definitions is the column chart definition? Please choose one: a. It is a…
A: Column chart: Description of a column chart: *Also referred to as a vertical bar chart. *Each…
Q: Refer to the data set of body temperatures in degrees Fahrenheit given in the accompanying table and…
A: Data given…
Q: 2. A certain chemical pollutant in the Pasig River has been constant for several years with mean…
A: The chemical pollutant in the Pasig river is constant with a mean of 34 parts per million. A group…
Q: Find a quadratic mean for the :following data Class Frequency Intervals 2.30-2.39
A: The quadratic mean is also called as root mean square. This is one of the types of average, based on…
Q: A researcher wants to include the variable "skill" in a regression, but cannot find a proper metric…
A: Note: Hi, thank you for the question. As per our company guideline we are supposed to answer only…
Q: 4. Find: a. Mean b. Median c. Mode Years of Experience Number of Employees 16 20 28 24 16 11 5 1-4…
A: The formula of mean is,Where,∑fx denotes the sum of product of frequency and midpoint.N denotes the…
Q: Q. 24 What is the difference between absolute and relative dispersion?
A:
Trending now
This is a popular solution!
Step by step
Solved in 2 steps
- 2. A.) Find the 5-number summary for the data. B.) Is the data discrete or continuous?The number of goals for each of a hockey player's seasons is given in the following figure. Find the mean, median, and mode of the number of goals per season for the hockey player. (If more than one mode exists, separate your answers with commas. If an answer does not exist, enter DNE.) mean 45 median mode Season Goals 1979-80 51 1980-81 55 1981-82 92 1982-83 71 1983-84 87 1984-85 73 1985-86 52 1986-87 62 1987-88 43 1988-89 54 Season Goals 1989-90 43 1990-91 41 1991-92 31 1992-93 16 1993-94 38 1994-95 11 1995-96 23 1996-97 25 1997-98 23 1998-99 9HOTSPOT LABEL The times (in seconds) of 8 runners for the 100-yard dash are recorded and used to determine the following calculations. Mean: 11.8 Median: 12.2 CO Mode: 12.5 Range: 3.2 The timekeeper had difficulties with the stopwatch and did not start the time until the runners had been running for 1.5 seconds. What would these calcula- tions be if this 1.5 seconds were added to each runner's 100-yard dash time? . Press each hotspot. Label the corresponding number below with the requested value. ▶ C «» Press to hear a reminder or hint for this problem. IQR: 2.4 100 All Charge
- The pairs of observations in the following material tell how many convenience stores in a city have been robbed during the year and how far that convenience store is from the nearest police station. Material: Distance (km) Robberies (pcs)5.8 40.2 212.3 93.7 41.4 39.5 915.0 117.7 6 Question: We want to know if the number of robberies is related to the distance of the convenience store from the nearest police station.(a) What hypothesis should be tested? Clearly formulate both the null and counter hypothesis and verbally explain their interpretation.(b) Test the hypothesis you just formed at the 5% significance level.(c) Repeat (b) at the 1% significance level. In the assignments, you must not use the ready-made function of the R software or other software for linear regression, i.e. the assignments must be solved using…Let p be the population proportion for the following condition. Find the point estimates for p and g. Of 963 children surveyed, 114 plan to join the armed forces in the future. The point estimate for p, p, is (Round to three decimal places as needed.) P. P. es Help me solve this View an example Get more help- Media . Clear all Check answer Copyright © 2021 Pearson Education Inc. All rights reserved. Terms of UseI Privacy Policy I Permissions Contact Us nere to search 53°F A @ E 99+ 10/05/17The depths (in inches) at which 10 artifacts are found are listed. Complete parts (a) and (b) below. 37.9 26.4 32.1 28.4 46.7 27.7 36.5 31.9 24.8 25.2 D (a) Find the range of the data set. Range = (Round to the nearest tenth as needed.) (b) Change 46.7 to 51.3 and find the range of the new data set. Range= (Round to the nearest tenth as needed.)
- The depths (in inches) at which 10 artifacts are found are listed. Complete parts (a) and (b) below. 25.5 41.5 35.9 38.8 45.3 36.7 23.1 31.2 36.6 30.7 O (a) Find the range of the data set. Range = (Round to the nearest tenth as needed.) (b) Change 45.3 to 54.5 and find the range of the new data set. Range =O (Round to the nearest tenth as needed.)175% O ALTITUDES (OH MYI (ОН МУН en information to find each value. 2. Find x and RT if SU is a median of ARST. on TU UR def of 2x+24 2x +24=5x-30D medion 5x-30 X =18 X-18 RT=1203. ……..Plot is used to study patterns in the values of a numeric variable over time. 1 point Time-Series Frequency polygon Doughnut chart