
Practical Management Science
6th Edition
ISBN: 9781337406659
Author: WINSTON, Wayne L.
Publisher: Cengage,
expand_more
expand_more
format_list_bulleted
Related questions
Question
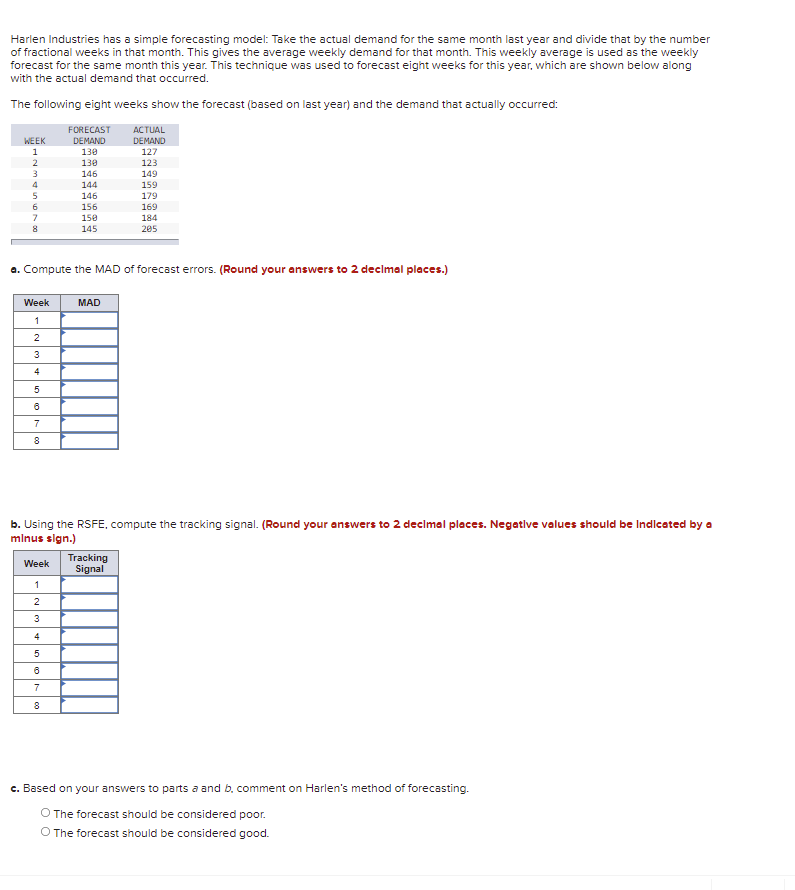

Transcribed Image Text:Harlen Industries has a simple forecasting model: Take the actual demand for the same month last year and divide that by the number of fractional weeks in that month. This gives the average weekly demand for that month. This weekly average is used as the weekly forecast for the same month this year. This technique was used to forecast eight weeks for this year, which are shown below along with the actual demand that occurred:
The following eight weeks show the forecast (based on last year) and the demand that actually occurred:
| Week | Forecast Demand | Actual Demand |
|------|-----------------|---------------|
| 1 | 130 | 127 |
| 2 | 138 | 123 |
| 3 | 146 | 149 |
| 4 | 144 | 159 |
| 5 | 146 | 179 |
| 6 | 156 | 169 |
| 7 | 158 | 184 |
| 8 | 145 | 205 |
a. Compute the MAD of forecast errors. (Round your answers to 2 decimal places.)
| Week | MAD |
|------|------|
| 1 | |
| 2 | |
| 3 | |
| 4 | |
| 5 | |
| 6 | |
| 7 | |
| 8 | |
b. Using the RSFE, compute the tracking signal. (Round your answers to 2 decimal places. Negative values should be indicated by a minus sign.)
| Week | Tracking Signal |
|------|-----------------|
| 1 | |
| 2 | |
| 3 | |
| 4 | |
| 5 | |
| 6 | |
| 7 | |
| 8 | |
c. Based on your answers to parts a and b, comment on Harlen’s method of forecasting.
- The forecast should be considered poor.
- The forecast should be considered good.
Expert Solution
This question has been solved!
Explore an expertly crafted, step-by-step solution for a thorough understanding of key concepts.

This is a popular solution

Trending nowThis is a popular solution!

Step by stepSolved in 2 steps with 2 images

Knowledge Booster

Similar questions
- State which forecast is best on the result for a., b., and c. forecasts. Explain your answer.arrow_forward10. Lenovo uses the ZX-81 chip in some of its laptop computers. The prices for the chip during the last 4 months were as follows: Month Price Per Chip January $1.85 February $1.61 March $1.63 April $1.83 This exercise contains only parts a, b, and c. Part 2 a) Using a 2-month moving average, calculate the forecast for March and April (round your responses to two decimal places). Month Mar Apr Forecast $________ $________arrow_forwardNeed help with the forecast for year 10. Linear trend linearrow_forward
- The number of internal disk drives (in millions) made at a plant in Taiwan during the past 5 years follows: F Year 4 Disk Drives 142 164 196 204 216 B a) Using simple linear regression, the forecast for the number of disk drives to be made next year-isk drives (round your response to one decimal place)arrow_forwardPls solve this question correctly instantly in 5 min i will give u 3 like for surearrow_forward(4) Exponential smoothing with a smoothing constant equal to 0.15, assuming a March forecast of 15(000). (Round your intermediate forecast values and final answer to 2 decimal places.) Forecast thousands (5) A linear trend equation. (Round your intermediate calculations and final answer to 2 decimal places.) Yt thousandsarrow_forward
- Calculate MSE for the 4 periods for which the actual and forecasted number of customers given in the table below: Forecasted Actual Number Period Number of Error of Customers Customers 1 1,975 2,000 2 2,050 2,025 3 1,925 1,975 4 2,075 2,025 390.63 37.5 6,250 True1,562.5arrow_forwardplease answer in excel Jean’s Copiers sells and repairs photocopy machines. The manager needs weekly forecasts of service calls so that she can schedule the personnel. The manager uses α = 0.3 for exponential smoothing, and the forecast for the first week was 24 calls. The manager also uses 3 weekly moving averages technique. a) Using 3 period moving averages, forecast the number of calls for week 7. b) Using exponential smoothing, forecast the number of calls for week 7. c) Compare these two forecasting techniques using Mean Squared Errors (MSE) measure. Which one is better?arrow_forward8. Calculate (a) MAD and (b) MSE for the following forecast versus actual sales figures: Forecast 100 110 120 130 Actual 95 108 123 130 Part 2 a) MAD= __________ (round your response to one decimal place).arrow_forward
- Week 1 2 4 Forecast Method 1 0.90 1.05 0.97 1.22 Actual Demand 0.72 1.05 1.00 0.97 Week 1 2 3 4 Forecast Method 2 0.82 1.19 0.90 1.17 Actual Demand 0.72 1.05 1.00 0.97 0 The MAD for Method 1 = thousand gallons (round your response to three decimal places). The mean squared error (MSE) for Method 1 = thousand gallons (round your response to three decimal places). The MAD for Method 2 = thousand gallons (round your response to three decimal places). The mean squared error (MSE) for Method 2 = thousand gallons (round your response to three decimal places).arrow_forwardShow your solution. Please write down your answer. No excel please. Thank you.arrow_forwardAssume today's date is 12/31/2023. Actual sales and forecast for 2023 are given below. Actual Forecast 2023 72.4 66.9 59.5 61.2 260 2023 69 67 Q3 61 Q4 59 Total 256 Obtain the MAD Q1 Q2 7.2 1.8 -1arrow_forward
arrow_back_ios
SEE MORE QUESTIONS
arrow_forward_ios
Recommended textbooks for you
- Practical Management ScienceOperations ManagementISBN:9781337406659Author:WINSTON, Wayne L.Publisher:Cengage,
 Operations ManagementOperations ManagementISBN:9781259667473Author:William J StevensonPublisher:McGraw-Hill Education
 Operations and Supply Chain Management (Mcgraw-hi...Operations ManagementISBN:9781259666100Author:F. Robert Jacobs, Richard B ChasePublisher:McGraw-Hill Education
 Purchasing and Supply Chain ManagementOperations ManagementISBN:9781285869681Author:Robert M. Monczka, Robert B. Handfield, Larry C. Giunipero, James L. PattersonPublisher:Cengage Learning
 Production and Operations Analysis, Seventh Editi...Operations ManagementISBN:9781478623069Author:Steven Nahmias, Tava Lennon OlsenPublisher:Waveland Press, Inc.
Practical Management Science
Operations Management
ISBN:9781337406659
Author:WINSTON, Wayne L.
Publisher:Cengage,
Operations Management
Operations Management
ISBN:9781259667473
Author:William J Stevenson
Publisher:McGraw-Hill Education
Operations and Supply Chain Management (Mcgraw-hi...
Operations Management
ISBN:9781259666100
Author:F. Robert Jacobs, Richard B Chase
Publisher:McGraw-Hill Education
Purchasing and Supply Chain Management
Operations Management
ISBN:9781285869681
Author:Robert M. Monczka, Robert B. Handfield, Larry C. Giunipero, James L. Patterson
Publisher:Cengage Learning
Production and Operations Analysis, Seventh Editi...
Operations Management
ISBN:9781478623069
Author:Steven Nahmias, Tava Lennon Olsen
Publisher:Waveland Press, Inc.