A First Course in Probability (10th Edition)
10th Edition
ISBN: 9780134753119
Author: Sheldon Ross
Publisher: PEARSON
expand_more
expand_more
format_list_bulleted
Question

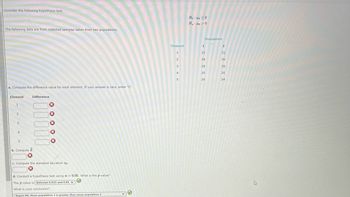
Transcribed Image Text:Consider the following hypothesis test.
The following data are from matched samples taken from two populations.
a. Compute the difference value for each element. If your answer is zero, enter "0".
Element
1
2
3
4
5
Difference
b. Compute d.
*
×
X
*
×
c. Compute the standard deviation $4.
d. Conduct a hypothesis test using a = 0.05. What is the p-value?
The p-value is between 0.025 and 0.05
S
What is your conclusion?
Reject HO, Mean population 1 is greater than mean population 2
Element
1
2
3
4
5
Ho Hd ≤0
H₁: Hd > 0
Population
1
22
28
18
20
26
2
21
26
18
20
24
4
Expert Solution
This question has been solved!
Explore an expertly crafted, step-by-step solution for a thorough understanding of key concepts.
This is a popular solution
Trending nowThis is a popular solution!
Step by stepSolved in 3 steps

Knowledge Booster
Similar questions
- The number of goals for each of a hockey player's seasons is given in the following figure. Find the mean, median, and mode of the number of goals per season for the hockey player. (If more than one mode exists, separate your answers with commas. If an answer does not exist, enter DNE.) mean 45 median mode Season Goals 1979-80 51 1980-81 55 1981-82 92 1982-83 71 1983-84 87 1984-85 73 1985-86 52 1986-87 62 1987-88 43 1988-89 54 Season Goals 1989-90 43 1990-91 41 1991-92 31 1992-93 16 1993-94 38 1994-95 11 1995-96 23 1996-97 25 1997-98 23 1998-99 9arrow_forwardSuppose that 50 measurements were taken and the mean was calculated to be 4.55. Assume next that one of the data items was 19.4This was assumed to be an outlier as was discarded. What would be the mean of the remaining 49 numbers? Iarrow_forwardAssume that the readings on the thermometers are normally distributed with a mean of 0 degrees and standard deviation of 1.00 degrees C. A thermometer is randomly selected and tested. Draw a sketch and find the temperature reading corresponding to Upper P 84, the 84 th percentile. This is the temperature reading separating the bottom 84 % from the top 16 %. A. Which graph represents Upper P 84? B. The temperature for Upper P 84 is approximately (Round to two decimal places as needed.)arrow_forward
- The values listed below are waiting times (in minutes) of customers at two different banks. At Bank A, customers enter a single waiting line that feeds three teller windows. At Bank B, customers may enter any one of three different lines that have formed at three teller windows. Answer the following questions. Bank A 6.3 4.3 6.6 7.0 7.0 Bank B 5.4 5.8 6.1 6.8 78 8.5 10.0 A Click the icon to view the table of Chi-Square critical values. Construct a 95% confidence interval for the population standard deviation a at Bank A O minarrow_forwardFive pulse rates are randomly selected from a set of measurements. The five pulse rates have a mean of 68.6 beats per minute. Four of the pulse rates are 74, 70, 51, and 93. a. Find the missing value. b. Suppose that you need to create a list of n values that have a specific known mean. Some of the n values can be freely selected. How many of the n values can be freely assigned before the remaining values are determined? (The result i referred to as the number of degrees of freedom.) a. The missing value is beats per minute. (Type an integer or a decimal. Do not round.) b. Select the correct choice below and fill in the answer box to complete your choice. (Type an expression using n as the variable.) OA. Of the n values, OB. Of the n values, O C. Of the n values, (...) can be freely selected because the remaining value(s) can be expressed in terms of the assigned values and the known mean. can be freely selected because the remaining value(s) can be expressed in terms of the mean,…arrow_forwardAnswer for b c darrow_forwardSuppose there are 5 students in a room. The mean age is 19.8 years, and the median age is 19. If the youngest person leaves and is not replaced by another person, what happens to the mean and the median? O The mean and median increase. The mean increases, and the median either increases or stays the same. The mean increases, but it is impossible to determine whether the median increases, decreases, or stays the same. The mean increases, and the median stays the same. The median increases, and the mean either increases or stays the same.arrow_forwardThe geometrlc mean Is under O a. Measures of Location O b. None c. Measures of Scales O d. Measures of variationarrow_forwardAssume that the readings on the thermometers are normally distributed with a mean of 0° and standard deviation of 1.00°C. A thermometer is randomly selected and tested. Draw a sketch and find the temperature reading corresponding to P34, the 84th percentile. This is the temperature reading separating the bottom 84% from the top 16%. Click to view page 1 of the table. Click to view page 2 of the table. Which graph represents P ? Choose the correct graph below. 84 A. В. OC. D. Ay X The temperature for P84 is approximately (Round to two decimal places as needed.)arrow_forwardarrow_back_iosarrow_forward_ios
Recommended textbooks for you
 A First Course in Probability (10th Edition)ProbabilityISBN:9780134753119Author:Sheldon RossPublisher:PEARSON

A First Course in Probability (10th Edition)
Probability
ISBN:9780134753119
Author:Sheldon Ross
Publisher:PEARSON
