
MATLAB: An Introduction with Applications
6th Edition
ISBN: 9781119256830
Author: Amos Gilat
Publisher: John Wiley & Sons Inc
expand_more
expand_more
format_list_bulleted
Related questions
Question
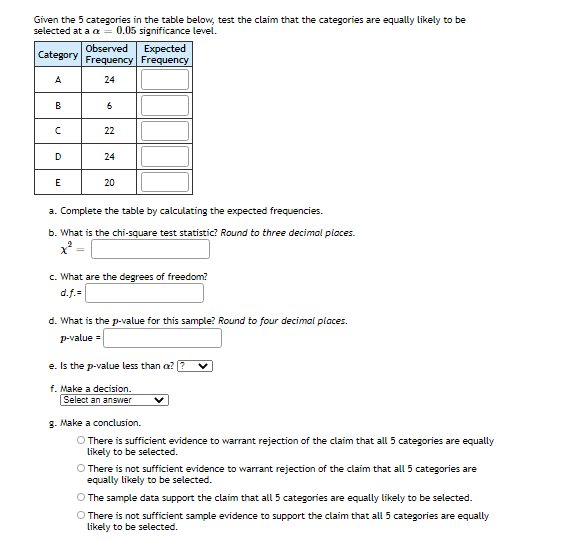

Transcribed Image Text:Given the 5 categories in the table below, test the claim that the categories are equally likely to be
selected at a a
0.05 significance level.
Observed
Expected
Category
Frequency Frequency
A
24
B
22
D
24
E
20
a. Complete the table by calculating the expected frequencies.
b. What is the chi-square test statistic? Round to three decimal places.
c. What are the degrees of freedom?
d.f.=
d. What is the p-value for this sample? Round to four decimal places.
P-value =
e. Is the p-value less than a?
f. Make a decision.
Select an answer
g. Make a conclusion.
There is sufficient evidence to warrant rejection of the claim that all 5 categories are equally
Likely to be selected.
O There is not sufficient evidence to warrant rejection of the claim that all 5 categories are
equally likely to be selected.
O The sample data support the claim that all 5 categories are equally likely to be selected.
O There is not sufficient sample evidence to support the claim that all 5 categories are equally
Likely to be selected.
Expert Solution
This question has been solved!
Explore an expertly crafted, step-by-step solution for a thorough understanding of key concepts.

This is a popular solution

Trending nowThis is a popular solution!

Step by stepSolved in 2 steps with 2 images

Knowledge Booster

Similar questions
- A sample mean is calculated from a sample of size 20. How many degrees of freedom does the sampling distribution of sample means have? 18 19 20 21arrow_forwardConsider 5 Consider the data below that shows the number of COVID cases of the fifteen barangays in Naga City: {4, 7, 0, 3, 2, 1, 2, 1, 5, 4, 1, 3, 2, 3, 1). What is the mean of the data? T Decile Find the 5.5th decile of the data: 62, 60, 37, 57, 55, 59, 57, 50, 49, 61arrow_forwardDetermine whether the statement is true or false. If it is false, rewrite it as a true statement. A sampling distribution of a sample mean is normal only if the population is normal. Choose the correct answer below. O A. The statement is false. A sampling distribution of a sample mean is approximately normal if either n ≥ 30 or the population is normal. B. The statement is false. A sampling distribution of a sample mean is never normal. O C. The statement is false. A sampling distribution of a sample mean is approximately normal only if n ≥ 30. OD. The statement is true.arrow_forward
- Please answer quickly!arrow_forwardWhich statistic (mean, median, or mode) is most appropriate in each of the following situations? a. Tables in the dining hall are numbered 1 through 12 for students who eat there. The principal calls out a number for the table that will go through the buffet line first. The other tables follow in order of the table numbers. One student is sure the principal calls certain tables more often. She keeps track of which numbers are called over a 21-day period. Mean O Median Mode b. The offensive line of a football team is larger than in previous years. The program will list a statistic to show this fact. O Mean O Median Mode c. A reporter is doing a story on the falling prices of homes in a large neighborhood. The reporter wants to demonstrate how the prices have fallen for the typical home, not just the most expensive houses. Mean O Median Modearrow_forwardn, where k is the percentile and n is the sample size. Given a sorted sample of 234 IQ scores, what is the value of the 40th percentile? 100 When finding the value of a percentile, the location of that value is L = Choose the correct answer below. O A. The 93rd IQ score in the sorted list O B. The 40th IQ score in the sorted list. O C. The 94th IQ score in the sorted list O D. The IQ score midway between the 40th and 41st scores in the sorted list.arrow_forward
arrow_back_ios
arrow_forward_ios
Recommended textbooks for you
- MATLAB: An Introduction with ApplicationsStatisticsISBN:9781119256830Author:Amos GilatPublisher:John Wiley & Sons Inc
 Probability and Statistics for Engineering and th...StatisticsISBN:9781305251809Author:Jay L. DevorePublisher:Cengage Learning
 Statistics for The Behavioral Sciences (MindTap C...StatisticsISBN:9781305504912Author:Frederick J Gravetter, Larry B. WallnauPublisher:Cengage Learning
  Elementary Statistics: Picturing the World (7th E...StatisticsISBN:9780134683416Author:Ron Larson, Betsy FarberPublisher:PEARSON
 The Basic Practice of StatisticsStatisticsISBN:9781319042578Author:David S. Moore, William I. Notz, Michael A. FlignerPublisher:W. H. Freeman
 Introduction to the Practice of StatisticsStatisticsISBN:9781319013387Author:David S. Moore, George P. McCabe, Bruce A. CraigPublisher:W. H. Freeman
MATLAB: An Introduction with Applications
Statistics
ISBN:9781119256830
Author:Amos Gilat
Publisher:John Wiley & Sons Inc
Probability and Statistics for Engineering and th...
Statistics
ISBN:9781305251809
Author:Jay L. Devore
Publisher:Cengage Learning
Statistics for The Behavioral Sciences (MindTap C...
Statistics
ISBN:9781305504912
Author:Frederick J Gravetter, Larry B. Wallnau
Publisher:Cengage Learning
Elementary Statistics: Picturing the World (7th E...
Statistics
ISBN:9780134683416
Author:Ron Larson, Betsy Farber
Publisher:PEARSON
The Basic Practice of Statistics
Statistics
ISBN:9781319042578
Author:David S. Moore, William I. Notz, Michael A. Fligner
Publisher:W. H. Freeman
Introduction to the Practice of Statistics
Statistics
ISBN:9781319013387
Author:David S. Moore, George P. McCabe, Bruce A. Craig
Publisher:W. H. Freeman