
MATLAB: An Introduction with Applications
6th Edition
ISBN: 9781119256830
Author: Amos Gilat
Publisher: John Wiley & Sons Inc
expand_more
expand_more
format_list_bulleted
Related questions
Concept explainers
Question
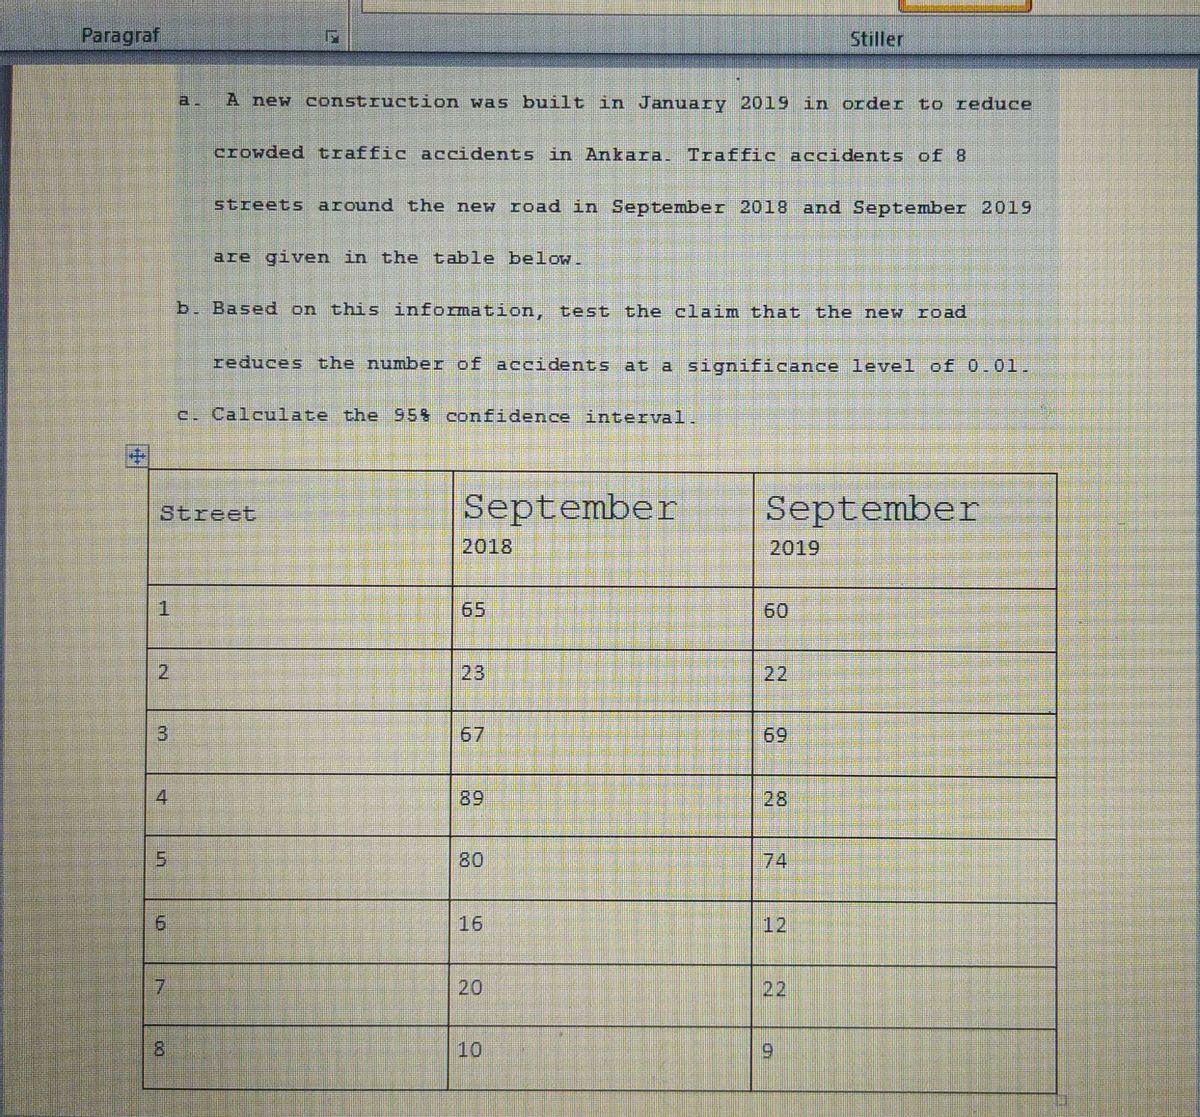

Transcribed Image Text:Paragraf
Stiller
a.
A new construction was built in January 2019 in order to reduce
CIOwded traffic accidents in Ankara. Traffic accidents of 8
streets around the new road in September 2018 and September 2019
are given in the table below.
b. Based on this information, test the claim that the new road
reduces the number of accidents at a significance level of 0.01.
c. Calculate the 958 confidence interval.
September
September
Street
2018
2019
1.
65
60
2.
23
22
67
69
4
89
28
80
74
9.
16
12
22
8.
10
20
3.
6.
Expert Solution
This question has been solved!
Explore an expertly crafted, step-by-step solution for a thorough understanding of key concepts.

Step by stepSolved in 4 steps with 4 images

Knowledge Booster


Learn more about
Need a deep-dive on the concept behind this application? Look no further. Learn more about this topic, statistics and related others by exploring similar questions and additional content below.Similar questions
- A. Construct a 95% confidence interval. Express the percentage in decimal form. _ < p < _ ( round to three decimal places as needed )arrow_forwardAmericans spend nearly $7 billion on Halloween costumes and decorations. Sample data showing the amount, in dollars, 16 adults spent on a Halloween costume are contained in the Excel Online file below. Construct a spreadsheet to answer the following questions. c. Provide a 95% confidence interval estimate of the population standard deviation for the amount adults spend on a Halloween costume (to 2 decimals)? The numbers provided: 13, 66, 21, 67, 33, 33, 31, 45, 51, 14, 12, 95, 46, 34, 62, 27arrow_forward1arrow_forward
- 3. A trial compares a new drug to that considered standard care in patients undergoing knee replacement surgery. The outcome of interest is whether patients report a reduction in pain by 3+ scale points or not. Construct a 95% confidence interval for the difference in proportions of patients between treatments who report a pain reduction of 3+ points. Reduction of 3+ Points Treatment n Number Proportion New Drug 50 40 0.8 Standard 50 15 0.3arrow_forwarda. Predict the Starting Salary for students with a cumulative GPA of 5.5 upon graduation. b. Use the template to generate a 98% confidence interval for the mean around your prediction.arrow_forward3- Is climate change an important issue? Use the following samples to answer the questions. Gender yes noe 110 80 Male 250 140 Not Male 300 220 a. Construct and interpret a 95% confidence interval for the difference between the two population proportions. b. Test if a larger proportion of Not Male believe climate change is an important issue. Calculate and interpret the p-value. (a is not given)earrow_forward
arrow_back_ios
arrow_forward_ios
Recommended textbooks for you
- MATLAB: An Introduction with ApplicationsStatisticsISBN:9781119256830Author:Amos GilatPublisher:John Wiley & Sons Inc
 Probability and Statistics for Engineering and th...StatisticsISBN:9781305251809Author:Jay L. DevorePublisher:Cengage Learning
 Statistics for The Behavioral Sciences (MindTap C...StatisticsISBN:9781305504912Author:Frederick J Gravetter, Larry B. WallnauPublisher:Cengage Learning
  Elementary Statistics: Picturing the World (7th E...StatisticsISBN:9780134683416Author:Ron Larson, Betsy FarberPublisher:PEARSON
 The Basic Practice of StatisticsStatisticsISBN:9781319042578Author:David S. Moore, William I. Notz, Michael A. FlignerPublisher:W. H. Freeman
 Introduction to the Practice of StatisticsStatisticsISBN:9781319013387Author:David S. Moore, George P. McCabe, Bruce A. CraigPublisher:W. H. Freeman
MATLAB: An Introduction with Applications
Statistics
ISBN:9781119256830
Author:Amos Gilat
Publisher:John Wiley & Sons Inc
Probability and Statistics for Engineering and th...
Statistics
ISBN:9781305251809
Author:Jay L. Devore
Publisher:Cengage Learning
Statistics for The Behavioral Sciences (MindTap C...
Statistics
ISBN:9781305504912
Author:Frederick J Gravetter, Larry B. Wallnau
Publisher:Cengage Learning
Elementary Statistics: Picturing the World (7th E...
Statistics
ISBN:9780134683416
Author:Ron Larson, Betsy Farber
Publisher:PEARSON
The Basic Practice of Statistics
Statistics
ISBN:9781319042578
Author:David S. Moore, William I. Notz, Michael A. Fligner
Publisher:W. H. Freeman
Introduction to the Practice of Statistics
Statistics
ISBN:9781319013387
Author:David S. Moore, George P. McCabe, Bruce A. Craig
Publisher:W. H. Freeman