
MATLAB: An Introduction with Applications
6th Edition
ISBN: 9781119256830
Author: Amos Gilat
Publisher: John Wiley & Sons Inc
expand_more
expand_more
format_list_bulleted
Related questions
Concept explainers
Question

Transcribed Image Text:ý Ao v =
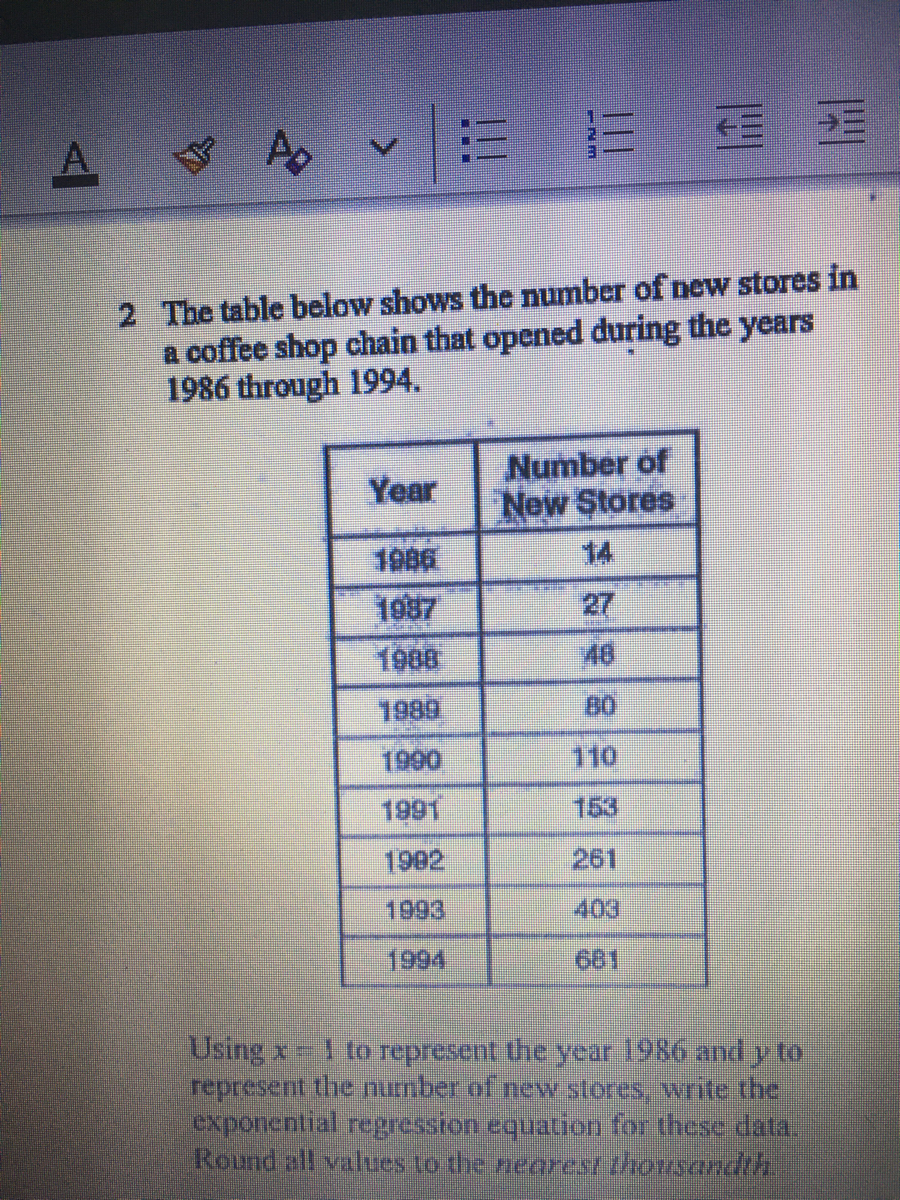
2 The table below shows the number of new stores in
a coffee shop chain that opened during the years
1986 through 1994.
Number of
New Stores
Year
14
1986
1087
27
1900
46
1989
80
1990
110
1991
153
1902
261
1993
403
1994
601
Using x
represent the number of new stores, write the
exponential regression equation for these data.
Round ell values to the nearest thousandth
I to represent the year 1986 and y to
Expert Solution
arrow_forward
Step 1
We have to find regration equation

Trending nowThis is a popular solution!

Step by stepSolved in 2 steps with 1 images

Knowledge Booster


Learn more about
Need a deep-dive on the concept behind this application? Look no further. Learn more about this topic, statistics and related others by exploring similar questions and additional content below.Similar questions
- A study was done to look at the relationship between number of vacation days employees take each year and the number of sick days they take each year. The results of the survey are shown below. Vacation Days 5 15 13 3 9 0 3 7 7 14 4 Sick Days 5 5 1 5 4 9 9 6 5 3 9 Use the model to predict the number of sick days taken for an employee who took 3 vacation days this year.Sick Days = ? (Please round your answer to the nearest whole number.) Interpret the slope of the regression line in the context of the question: As x goes up, y goes down. The slope has no practical meaning since a negative number cannot occur with vacation days and sick days. For every additional vacation day taken, employees tend to take on average 0.40 fewer sick days. Interpret the y-intercept in the context of the question: The y-intercept has no practical meaning for this study. If an employee takes no vacation days, then that employee will take 8 sick days. The average number of sick days is…arrow_forwardUse the scatterplot of Vehicle Registrations below to answer the questions Vehicle Registrations in the United States, 1925- 2011 Vehicles millions 300 y = 3.0161x - 5819.5 R? = 0.9695 250 200 150 100 50 1920 -50 1940 1960 1980 2000 2020 Year Write a sentence explaining the value of the slope for this regression line. For every increase in year, the number of vehicle registrations in the US increases by 3.0161 million. For every increase in year, the number of vehicle registrations in the US increases by 5819.5. For every increase in vehicle registrations in the US, the number of years increases by 5819.5. For every increase in vehicle registrations in the US, the number of years increases by 3.0161 million. Registrations (in millions)arrow_forwardThe data show the chest size and weight of several bears. Find the regression equation, letting chest size be the independent (x) variable. Then find the best predicted weight of a bear with a chest size of 40 inches. Is the result close to the actual weight of 352 pounds? Use a significance level of 0.05. Chest size (inches) *Weight (pounds) 44 54 328 528 41 55 39 51 418 580 296 503 Click the icon to view the critical values of the Pearson correlation coefficient r. - What is the regression equation? x (Round to one decimal place as needed.)arrow_forward
- The table shows the national expenditures for health care in billions, in a country for the selected years from 1990 to 2020. Given the projection cost for the year 2002, identify the type of regression point. Year Exprenditures ($billions) 1991 1020 1994 1356 1998 1984 2004 2984 2009 3374 2016 4765 2020 5937 Interpolation Extrapolation Neither Botharrow_forwardFind the equation of the regression line for the following data: X 23 43 29 32 46 22 37 y 56 8 44 35 13 48 20arrow_forwardFind the regression equation, letting the first variable be the predictor (x) variable. Using the listed actress/actor ages in various years, find the best predicted age of the Best Actor winner given that the age of the Best Actress winner that year is 34 years. Is the result within 5 years of the actual Best Actor winner, whose age was 47 years? Best Actress 27 32 28 59 32 34 46 28 64 23 43 54 Best Actor 42 36 37 43 48 47 60 53 40 53 45 34 Find the equation of the regression line. y=_ +(_)xarrow_forward
- Find the regression equation, letting the first variable be the predictor (x) variable. Using the listed actress/actor ages in various years, find the best predicted age of the Best Actor winner given that the age of the Best Actress winner that year is 27 years. Is the result within 5 years of the actual Best Actor winner, whose age was 43 years? Best Actress 27 32 30 63 30 31 47 30 61 22 46 54 9 Best Actor 43 39 37 46 48 48 62 49 38 56 42 35arrow_forwardFind the regression equation, letting the first variable be the predictor (x) variable. Using the listed actress/actor ages in various years, find the best predicted age of the Best Actor winner given that the age of the Best Actress winner that year is 31 years. Is the result within 5 years of the actual Best Actor winner, whose age was 38 years? Best Actress Best Actor 27 31 29 59 33 42 38 36 43 53 34 47 22 46 55 39 57 45 33 44 28 63 62 49 *** Find the equation of the regression line. ŷ=0+0x (Round the y-intercept to one decimal place as needed. Round the slope to three decimal places as needed.)arrow_forwardneed help with followingarrow_forward
- Find the regression equation, letting the first variable be the predictor (x) variable. Using the listed actress/actor ages in various years, find the best predicted age of the Best Actor winner given that the age of the Best Actress winner that year is 32 years. Is the result within 5 years of the actual Best Actor winner, whose age was 48 years? Best Actress 29 31 28 58 32 33 43 29 64 21 44 Best Actor 41 49 59 48 37 52 44 35 36 43 48 y 57 35 Find the equation of the regression line. ŷ=+xx (Round the y-intercept to one decimal place as needed. Round the slope to three decimal places as needed.)arrow_forwardLife expectancy in the United States has been rising since the nineteenth century. The table shows the U.S. life expectancy in selected years. Year 1950 1960 1970 1980 1990 2000 Life expectancy at birth 68.2 69.7 70.8 73.7 75.4 77 a. Let t represent the number of years after 1950, and plot the data. Draw a line a best fit for the data points. 80+ 76- 5 10 15 20 25 30 35 40 45 50 Draw: 72+ 64- 60+ 56 52 48- 44 Clear Allarrow_forwardPlease help me. Thankyou.arrow_forward
arrow_back_ios
arrow_forward_ios
Recommended textbooks for you
- MATLAB: An Introduction with ApplicationsStatisticsISBN:9781119256830Author:Amos GilatPublisher:John Wiley & Sons Inc
 Probability and Statistics for Engineering and th...StatisticsISBN:9781305251809Author:Jay L. DevorePublisher:Cengage Learning
 Statistics for The Behavioral Sciences (MindTap C...StatisticsISBN:9781305504912Author:Frederick J Gravetter, Larry B. WallnauPublisher:Cengage Learning
  Elementary Statistics: Picturing the World (7th E...StatisticsISBN:9780134683416Author:Ron Larson, Betsy FarberPublisher:PEARSON
 The Basic Practice of StatisticsStatisticsISBN:9781319042578Author:David S. Moore, William I. Notz, Michael A. FlignerPublisher:W. H. Freeman
 Introduction to the Practice of StatisticsStatisticsISBN:9781319013387Author:David S. Moore, George P. McCabe, Bruce A. CraigPublisher:W. H. Freeman
MATLAB: An Introduction with Applications
Statistics
ISBN:9781119256830
Author:Amos Gilat
Publisher:John Wiley & Sons Inc
Probability and Statistics for Engineering and th...
Statistics
ISBN:9781305251809
Author:Jay L. Devore
Publisher:Cengage Learning
Statistics for The Behavioral Sciences (MindTap C...
Statistics
ISBN:9781305504912
Author:Frederick J Gravetter, Larry B. Wallnau
Publisher:Cengage Learning
Elementary Statistics: Picturing the World (7th E...
Statistics
ISBN:9780134683416
Author:Ron Larson, Betsy Farber
Publisher:PEARSON
The Basic Practice of Statistics
Statistics
ISBN:9781319042578
Author:David S. Moore, William I. Notz, Michael A. Fligner
Publisher:W. H. Freeman
Introduction to the Practice of Statistics
Statistics
ISBN:9781319013387
Author:David S. Moore, George P. McCabe, Bruce A. Craig
Publisher:W. H. Freeman