Advanced Engineering Mathematics
10th Edition
ISBN: 9780470458365
Author: Erwin Kreyszig
Publisher: Wiley, John & Sons, Incorporated
expand_more
expand_more
format_list_bulleted
Question

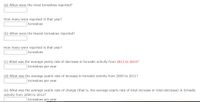
Transcribed Image Text:(a) When were the most tornadoes reported?
How many were reported in that year?
tornadoes
(b) When were the fewest tornadoes reported?
How many were reported in that year?
tornadoes
(c) What was the average yearly rate of decrease in tornadic activity from 2013 to 2014?
tornadoes per year
(d) What was the average yearly rate of increase in tornadic activity from 2009 to 2011?
tornadoes per year
(e) What was the average yearly rate of change (that is, the average yearly rate of total increase or total decrease) in tornadic
activity from 2009 to 2012?
tornadoes per year

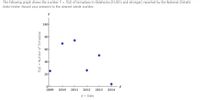
Transcribed Image Text:The following graph shows the number T = T(d) of tornadoes in Oklahoma (F1/EF1 and stronger) reported by the National Climatic
Data Center. Round your answers to the nearest whole number.
100
80
60
40
20
d
2014
2009
2010
2011
2012
2013
d = Date
T(d) Number of Tornadoes
Expert Solution
This question has been solved!
Explore an expertly crafted, step-by-step solution for a thorough understanding of key concepts.
This is a popular solution
Trending nowThis is a popular solution!
Step by stepSolved in 2 steps with 1 images

Knowledge Booster
Learn more about
Need a deep-dive on the concept behind this application? Look no further. Learn more about this topic, advanced-math and related others by exploring similar questions and additional content below.Similar questions
- 9b In Africa in 2011, the number of deaths of a female from cardiovascular disease for different age groups are in the table below ("Global health observatory," 2013). In addition, the proportion of deaths of females from all causes for the same age groups are also in table below. Table: Deaths of Females for Different Age Groups Age 5-14 15-29 30-49 50-69 Total Cardiovascular Frequency 8 16 56 433 513 All Cause Proportion 0.10 0.12 0.26 0.52 Do the data show that the death from cardiovascular disease are in the same proportion as all deaths for the different age groups? Test at the 5% level. (iv) Are any of the expected frequency values (for which HO is true) for any cell in your table less than 5? Calculate the expected frequencies using technology, the select most correct answer: A. yes - this will not affect results of hypothesis test B. yes - this may invalidate results of hypothesis test C. no - this will not affect…arrow_forward9a In Africa in 2011, the number of deaths of a female from cardiovascular disease for different age groups are in the table below ("Global health observatory," 2013). In addition, the proportion of deaths of females from all causes for the same age groups are also in table below. Table: Deaths of Females for Different Age Groups Age 5-14 15-29 30-49 50-69 Total Cardiovascular Frequency 8 16 56 433 513 All Cause Proportion 0.10 0.12 0.26 0.52 Do the data show that the death from cardiovascular disease are in the same proportion as all deaths for the different age groups? Test at the 5% level. (i) Which of the following statements correctly defines the null hypothesis HO? A. Deaths from cardiovascular disease in females are not in the same proportion as all deaths for the different age groups B. Deaths from cardiovascular disease in females are in the same proportion as all deaths for the different age groups C. neither of…arrow_forwardWhat climatic region would you expect to find the lowest rates of weathering? Temperate mid-latitude region O Warm and wet (tropics/rain forest) region Dry and hot (desert) regionarrow_forward
- Twenty-five randomly selected students were asked the number of movies they watched the previous week. The results are as follows. # of movies frequency 0 3 1 8 2 9 3 4 4 1arrow_forwardOBFW Publishers Frequency of births (in thousands) 500- 400- 300- 200- 100- 0 number of births: Births by mother's age (2008) 10 62 percentage of births: 202 369 415 441 487 470 460 403 326 252 177 20 30 Mother's age (in years) Use the provided histogram to answer questions about the number of births for each age group. 99 46 17 4 40 How many births occurred among women over the age of 38? 50 What percentage of births occurred among women between the ages of 16 and 18? Give your answer to one decimal place. %arrow_forwardOn the basis of a population survey, there were 84.4 million males and 98.2 million females 25 years old or older in a certain country. The educational attainment of the males and females is shown in the accompanying table. Complete parts (a) through (d) below.arrow_forward
- The following is a 7 by 2 Frequency Distribution Table concerning the systolic blood pressure of women. Systolic Blood Pressure of Women Frequency 80-99 9 100-119 24 120-139 7 140-159 3 160-179 2 180-199 1 Using the data in the given Frequency Distribution Table, create a Cumulative Frequency Distribution Table.arrow_forward9c In Africa in 2011, the number of deaths of a female from cardiovascular disease for different age groups are in the table below ("Global health observatory," 2013). In addition, the proportion of deaths of females from all causes for the same age groups are also in table below. Table: Deaths of Females for Different Age Groups Age 5-14 15-29 30-49 50-69 Total Cardiovascular Frequency 8 16 56 433 513 All Cause Proportion 0.10 0.12 0.26 0.52 Do the data show that the death from cardiovascular disease are in the same proportion as all deaths for the different age groups? Test at the 5% level. (vii) Comparing p-value and α value, which is the correct decision to make for this hypothesis test? A. Reject Ho B. Fail to reject Ho C. Accept Ho D. Accept HA Enter letter corresponding to correct answer. (viii) Select the statement that most correctly interprets the result of this test: A. The result is not statistically…arrow_forward23 part a, b, and carrow_forward
- 16 In 1970, the U.S. Armed Services instituted a lottery as a random selection process when 19- year old males were drafted into service. Each of the possible 366 possible birth dates was placed in a separate capsule and each capsule was placed in a large plastic drum. Those with the lowest lottery numbers were drafted before others. For example, the May 9th was 176. This meant that there would be 175 groups of males born on other days drafted before those who had been born on May 9th. The scatter plot below shows the median draft eligible number for each month of the year. The line that connects the points is sometimes called a median trace line. Which one of the following statement is TRUE? * Median Trace of Draft Lottery Numbers 240 220- 200- 180- 160 140 120 100 F M. A Median Draft Number toarrow_forwardFrequency 344.7 389.1 394.3 411.8 412.1 431.9 433.5 445 447.4 452.3 465.4 466 469.2 469.2 469.2 469.8 470.6 471.7 471.8 474.9 483 483.1 485 490.4 494.8 495.8 496.8 496.8 500 506.8 512.5 516.6 520.1 520.4 524.8 534.8 545.3 547.4 558.1 556.4 558.1 558.1 580.6 564.4 572.4 577.4 585 586.2 587.8 588.2 593.8 606.1 607.8 611.4 = 18 16 14 12 10 8 6 4 2 300 350 400 450 500 Find the first quartile for this data set. Q₁ length (cm) = 550 600 650 Find the third quartile for this data set. Q3² = Find the interquartile range for this data set. IQR = = Find the lower fence separating outliers from usual values. Fence Low Find the upper fence separating outliers from usual values. Fence higharrow_forwardA data set is summarized in the frequency table below. The data set contains a total of 30 data values. What is the missing frequency? Value Frequency 1 5 2 3 3 4 4 6 5 □ 6 2 7 3 8 4arrow_forward
arrow_back_ios
SEE MORE QUESTIONS
arrow_forward_ios
Recommended textbooks for you
 Advanced Engineering MathematicsAdvanced MathISBN:9780470458365Author:Erwin KreyszigPublisher:Wiley, John & Sons, Incorporated
 Numerical Methods for EngineersAdvanced MathISBN:9780073397924Author:Steven C. Chapra Dr., Raymond P. CanalePublisher:McGraw-Hill Education
 Introductory Mathematics for Engineering Applicat...Advanced MathISBN:9781118141809Author:Nathan KlingbeilPublisher:WILEY
 Mathematics For Machine TechnologyAdvanced MathISBN:9781337798310Author:Peterson, John.Publisher:Cengage Learning,


Advanced Engineering Mathematics
Advanced Math
ISBN:9780470458365
Author:Erwin Kreyszig
Publisher:Wiley, John & Sons, Incorporated

Numerical Methods for Engineers
Advanced Math
ISBN:9780073397924
Author:Steven C. Chapra Dr., Raymond P. Canale
Publisher:McGraw-Hill Education

Introductory Mathematics for Engineering Applicat...
Advanced Math
ISBN:9781118141809
Author:Nathan Klingbeil
Publisher:WILEY

Mathematics For Machine Technology
Advanced Math
ISBN:9781337798310
Author:Peterson, John.
Publisher:Cengage Learning,

