
A First Course in Probability (10th Edition)
10th Edition
ISBN: 9780134753119
Author: Sheldon Ross
Publisher: PEARSON
expand_more
expand_more
format_list_bulleted
Related questions
Question
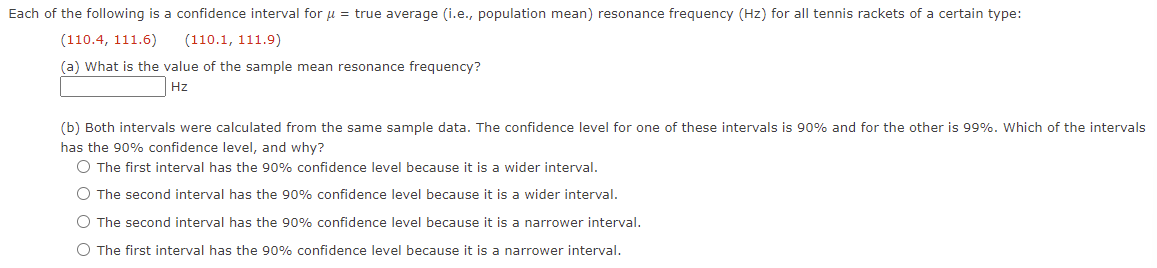

Transcribed Image Text:Each of the following is a confidence interval for u = true average (i.e., population mean) resonance frequency (Hz) for all tennis rackets of a certain type:
(110.4, 111.6)
(110.1, 111.9)
(a) What is the value of the sample mean resonance frequency?
Hz
(b) Both intervals were calculated from the same sample data. The confidence level for one of these intervals is 90% and for the other is 99%. Which of the intervals
has the 90% confidence level, and why?
O The first interval has the 90% confidence level because it is a wider interval.
O The second interval has the 90% confidence level because it is a wider interval.
O The second interval has the 90% confidence level because it is a narrower interval.
O The first interval has the 90% confidence level because it is a narrower interval.
Expert Solution
This question has been solved!
Explore an expertly crafted, step-by-step solution for a thorough understanding of key concepts.

This is a popular solution

Trending nowThis is a popular solution!

Step by stepSolved in 2 steps with 1 images

Knowledge Booster

Similar questions
- A survey was conducted in which both men and women were asked a question about a current issue. Possible responses to this question were “in favor of,” “not in favor of,” or “no opinion.” A chi-square test is to be used to determine whether the response to this question is independent of gender. The number of degrees of freedom for the chi-square test in this situation isarrow_forwardA cognitive psychologist conducted a study of whether familiarity of words (X) predicts the time it takes (in seconds) to press a button indicating whether the word is singular or plural (Y), with all participants being given the same words. Familiarity with these words was rated at a later time on a 7-point scale (with higher numbers indicating more familiarity). The participants' scores were: X : 6, 2, 5 ,3 ,7 Y : 0.3 , 1.5 , 0.8 , 1.4 ,0.1 a.Figure the correlation coefficient Describe the correlation Figure the linear prediction rule; list the b value, a value and the final formula Predict the time it takes to press a button if the familiarity with the word is 1arrow_forwardA researcher asked a group of 11 children to report on a 7-point Likert scale how sociable they feel first thing in the morning (low scores indicate not very sociable, high score indicate very sociable). The data in the frequency table below were obtained. The means is: Score 7 1 1 4 2 3 2 2. 1. N = 11 O 1.00 O 1.57 O 4.00 O 2.00 6.arrow_forward
- The population (in millions) and the violent crime rate (per 1000) were recorded for 10 metropolitan areas. The data are shown in the following table. Do these data provide evidence to reject the null hypothesis that ? = 0 in favor of ? ≠ 0 at ? = .05? (Give your answers correct to three decimal places.) Population 10.4 2 3.4 6 6.2 1.2 2.7 3.1 0.8 5 Crime Rate 12.6 8.9 7.5 8.9 7.8 9.3 8 7.4 8.6 9.3 (a) Calculate r. _______(ii) Calculate the critical region._____ (smaller value) ______(larger value)(b) State the appropriate conclusion. Reject the null hypothesis, there is not significant evidence that ? ≠ 0.Reject the null hypothesis, there is significant evidence that ? ≠ 0. Fail to reject the null hypothesis, there is not significant evidence that ? ≠ 0.Fail to reject the null hypothesis, there is significant evidence that ? ≠ 0.arrow_forwardA recent study investigated whether cell phone users experience separation anxiety when they cannot access their phones. Because blood pressure increases with anxiety, the researchers used systolic blood pressure as an operational measure of anxiety. The experiment involved a random sample of cell phone users that were divided into two groups at random. One group of participants completed a survey while their phones were locked in a cabinet in a separate room and the other group of participants completed the same survey while their phones were nearby. (The survey questions were unrelated to cell phone use.) At the end of the survey, theresearchers measured each participant's systolic blood pressure. The same experiment was conducted in Montreal, Toronto, Vancouver, and St. Zotique. The blood pressure data needed is below. Use these data to answer the following question: compute r2 for the data collected in st. zotique. Please answer to 5 decimal places. Cell Phone (CP) No Cell Phone…arrow_forwardPlease answer number 17.arrow_forward
- A researcher is interested in examining whether self-affirming oneself leads to increases in happiness scores. The researcher has a sample of 15 Grade 8 students spend 5 minutes each morning and evening repeating a series of positive statements to themselves in a mirror while looking right into their own eyes. After 30 days of doing this task, the researcher asks the subjects to rate their level of happiness on an interval scale of 1-10, where higher scores represent higher levels of happiness. Below are the data in Figure 1. SECTION I: Using the data from this histogram - Describe the shape of this distribution in the above histogram? - Given the shape and type of data, which measure of central tendency would you be more likely to report? Why? SECTION II: Using the standard normal curve, and the data obtained in Section I, answer the following questions: Is a student that scored X = 8 considered as being an extreme or typical score in the distribution? (Justify your response in one…arrow_forwardQuestion 9 Dr. Jameson wanted to know if IQ scores differed between male and female participants in his study. He gave 28 participants an IQ test and then compared IQ scores for gender differences. He hypothesized that there would be a statistically significant gender difference in IQ scores. Contrary to Dr. Jameson's hypothesis, there were no differences in IQ scores between men and women in his study. From the results of the study, Dr. Jameson must the research hypothesis. the null hypothesis and fail to reject; reject reject; retest reject; fail to reject retest; rejectarrow_forwardIs this correct so far?arrow_forward
- Step 2 of 3: Compute the value of the test statistic. Round your answer to three decimal places. tep 3 of 3: Draw a conclusion and interpret the decision.arrow_forwardDr.Blume has trained observers to use frequency recording to record the behavior of 12 schizophrenic clients. According to the analysis of the data κ = 0 . 47, do you think the observers are sufficiently trained to allow Dr. Blume to proceed with the research?arrow_forwardNonearrow_forward
arrow_back_ios
SEE MORE QUESTIONS
arrow_forward_ios
Recommended textbooks for you
- A First Course in Probability (10th Edition)ProbabilityISBN:9780134753119Author:Sheldon RossPublisher:PEARSON

A First Course in Probability (10th Edition)
Probability
ISBN:9780134753119
Author:Sheldon Ross
Publisher:PEARSON