
MATLAB: An Introduction with Applications
6th Edition
ISBN: 9781119256830
Author: Amos Gilat
Publisher: John Wiley & Sons Inc
expand_more
expand_more
format_list_bulleted
Related questions
Question
Need help with the following Stat question, thank you!
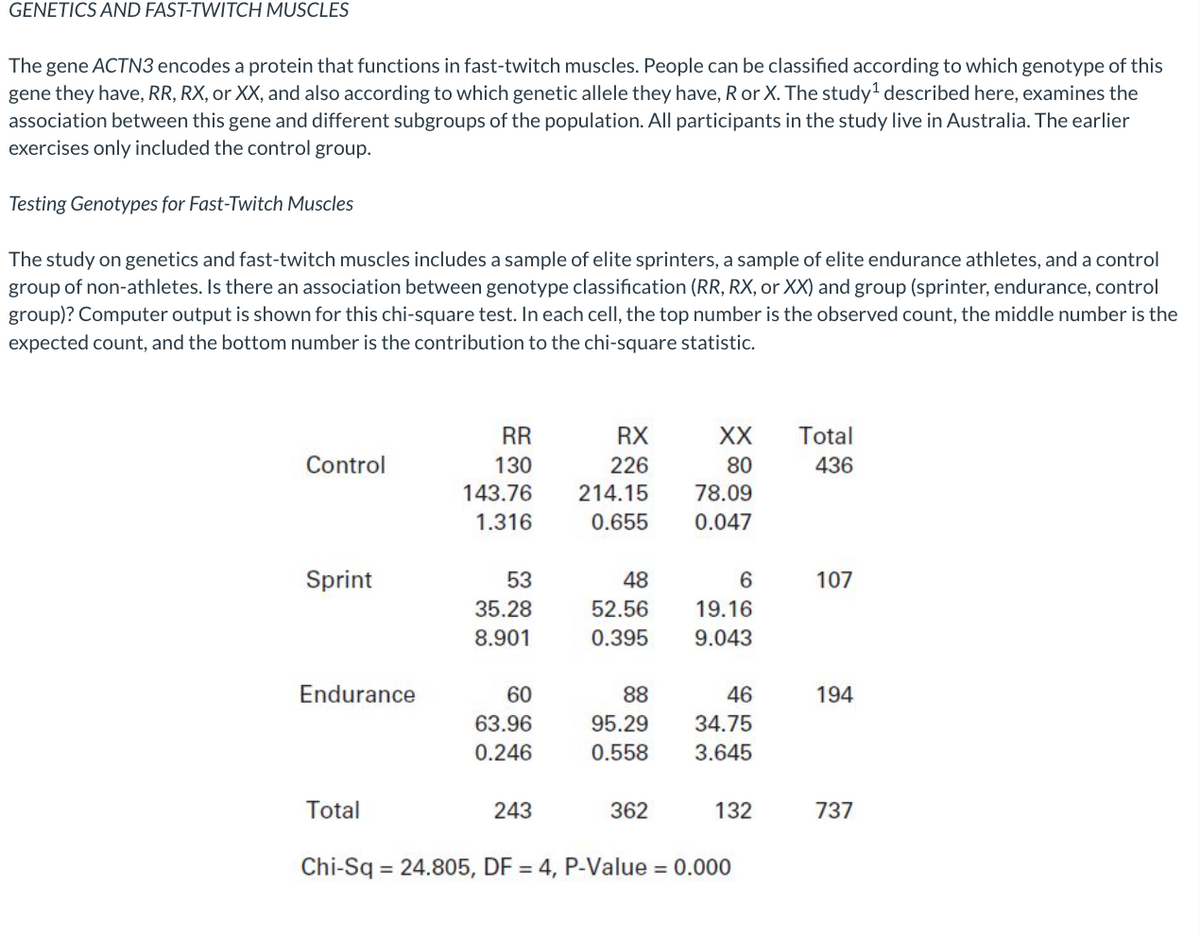

Transcribed Image Text:GENETICS AND FAST-TWITCH MUSCLES
The gene ACTN3 encodes a protein that functions in fast-twitch muscles. People can be classified according to which genotype of this
gene they have, RR, RX, or XX, and also according to which genetic allele they have, R or X. The study¹ described here, examines the
association between this gene and different subgroups of the population. All participants in the study live in Australia. The earlier
exercises only included the control group.
Testing Genotypes for Fast-Twitch Muscles
The study on genetics and fast-twitch muscles includes a sample of elite sprinters, a sample of elite endurance athletes, and a control
group of non-athletes. Is there an association between genotype classification (RR, RX, or XX) and group (sprinter, endurance, control
group)? Computer output is shown for this chi-square test. In each cell, the top number is the observed count, the middle number is the
expected count, and the bottom number is the contribution to the chi-square statistic.
Control
Sprint
Endurance
Total
RR
130
143.76
1.316
53
35.28
8.901
60
63.96
0.246
243
RX
226
214.15 78.09
0.655
0.047
48
52.56
0.395
88
95.29
0.558
XX
80
362
6
19.16
9.043
46
34.75
3.645
132
Chi-Sq = 24.805, DF = 4, P-Value = 0.000
Total
436
107
194
737

Transcribed Image Text:(a) What is the expected count for non-athletes with the RR genotype? For this cell, what is the contribution to the chi-square statistic?
Round your answer for the expected count to two decimal places, and your answer for the contribution to the chi-square statistic to
three decimal places.
Expected count = i
Contribution to the chi-square statistic = i
(b) What are the degrees of freedom for the test?
df =
(c) What is the chi-square test statistic? What is the p-value? What is the conclusion of the test?
chi-square statistic = i
p-value= i
Conclusion:
Ho.
Does the test indicate an association between these two variables?
(d) For the cell which contributes the most to the chi-square statistic, is the observed count greater than or less than the expected
count?
(e) Which genotype is most over-represented in sprinters?
Which genotype is most overrepresented in endurance athletes?
Expert Solution
This question has been solved!
Explore an expertly crafted, step-by-step solution for a thorough understanding of key concepts.

This is a popular solution

Trending nowThis is a popular solution!

Step by stepSolved in 5 steps

Knowledge Booster

Similar questions
- Work this problem involving a true/false and multiple choice test. Assume that the test has 7 true/false questions, and 11 muiltiple choice questions (3 options per questions), each with exactly one correct answer. If a student guesses randomly on each question, what is her expected score?arrow_forwardNo programming please. I don’t want a code as an answer.arrow_forwardPlease answer all parts. Thank you!arrow_forward
- Boand The Calege Entrance Examination Board was not involved in the production of this material Used with permission Copynight 2010 National Math Science Intative, Dalas, Texas. All rights reserved. Visit us online at www.nms.org. AP is a trademark of the College Entrance Ex atistics StatCorp Exploration Below are the monthly salaries for all 16 employees of the StatCorp Data Analysis Corporation. Answer the questions that follow by yourself or with a partner. Monthly salaries: 6,350 6,125 6,500 2,800 12,800 7,500 5,859 7,400 5,760 7,350 7,250 6,000 2,500 2,500 5,230 5,100 1. Find the mean, median., and standard deviation of employee's salaries. mean = median = standard deviation = 2. Business has been good, so every emplovee receives a raise of $1,000. What will happen to the mean, median, and standard deviation? The mean will The median will The standard deviation will Check yourself: median = standard deviation = mean = 3. Business has not been good. Suppose that we must cut…arrow_forwardou are doing a problem where you have a negative z-score, and you have to look up the proportion of the shaded area in the tail beyond that z-score; in other words, you are shading to the left from your z-score, and looking for the proportion that you shaded. Four “proportions” are given below. Which one is the ONLY one that could potentially be the number you are looking for? (Hint: Think about what you know about proportions: What kind of number are they? And what things can they represent?) Group of answer choices p = 0.3800 p = -0.1500 p = 1.1500 p = 0.5635arrow_forwardHi, please help thanksarrow_forward
- Consider the following 10 exam scores: 28, 57, 58, 64, 69, 74, 79, 80, 83, and 85 what is the mode?arrow_forwardshow work and why it might be negative if you get negative number please thank youarrow_forwardAs part of its interview process, an employment agency tests the client's typing speed. The stem-and-leaf display below shows the results for the most recent clients, 19 of whom received a job offer and 18 of whom did not. Answer the questions that follow. Typing speeds (words per minute) Offer No offer 922 39 776 5 21 41 366 88774442 50 23 44 5 67 8 90 6 4 888 Key: 32 + 2| 3 |9 + 39 (a) What were the ranges of typing speeds for the two groups? Offer No offer (b) Which group had the higher median typing speed? Offer ONo offer OThe medians were the same (c) Which group had more typing speeds in the 40s? O Offer ONo offer OEach had the samearrow_forward
arrow_back_ios
arrow_forward_ios
Recommended textbooks for you
- MATLAB: An Introduction with ApplicationsStatisticsISBN:9781119256830Author:Amos GilatPublisher:John Wiley & Sons Inc
 Probability and Statistics for Engineering and th...StatisticsISBN:9781305251809Author:Jay L. DevorePublisher:Cengage Learning
 Statistics for The Behavioral Sciences (MindTap C...StatisticsISBN:9781305504912Author:Frederick J Gravetter, Larry B. WallnauPublisher:Cengage Learning
  Elementary Statistics: Picturing the World (7th E...StatisticsISBN:9780134683416Author:Ron Larson, Betsy FarberPublisher:PEARSON
 The Basic Practice of StatisticsStatisticsISBN:9781319042578Author:David S. Moore, William I. Notz, Michael A. FlignerPublisher:W. H. Freeman
 Introduction to the Practice of StatisticsStatisticsISBN:9781319013387Author:David S. Moore, George P. McCabe, Bruce A. CraigPublisher:W. H. Freeman
MATLAB: An Introduction with Applications
Statistics
ISBN:9781119256830
Author:Amos Gilat
Publisher:John Wiley & Sons Inc
Probability and Statistics for Engineering and th...
Statistics
ISBN:9781305251809
Author:Jay L. Devore
Publisher:Cengage Learning
Statistics for The Behavioral Sciences (MindTap C...
Statistics
ISBN:9781305504912
Author:Frederick J Gravetter, Larry B. Wallnau
Publisher:Cengage Learning
Elementary Statistics: Picturing the World (7th E...
Statistics
ISBN:9780134683416
Author:Ron Larson, Betsy Farber
Publisher:PEARSON
The Basic Practice of Statistics
Statistics
ISBN:9781319042578
Author:David S. Moore, William I. Notz, Michael A. Fligner
Publisher:W. H. Freeman
Introduction to the Practice of Statistics
Statistics
ISBN:9781319013387
Author:David S. Moore, George P. McCabe, Bruce A. Craig
Publisher:W. H. Freeman