
MATLAB: An Introduction with Applications
6th Edition
ISBN: 9781119256830
Author: Amos Gilat
Publisher: John Wiley & Sons Inc
expand_more
expand_more
format_list_bulleted
Related questions
Topic Video
Question
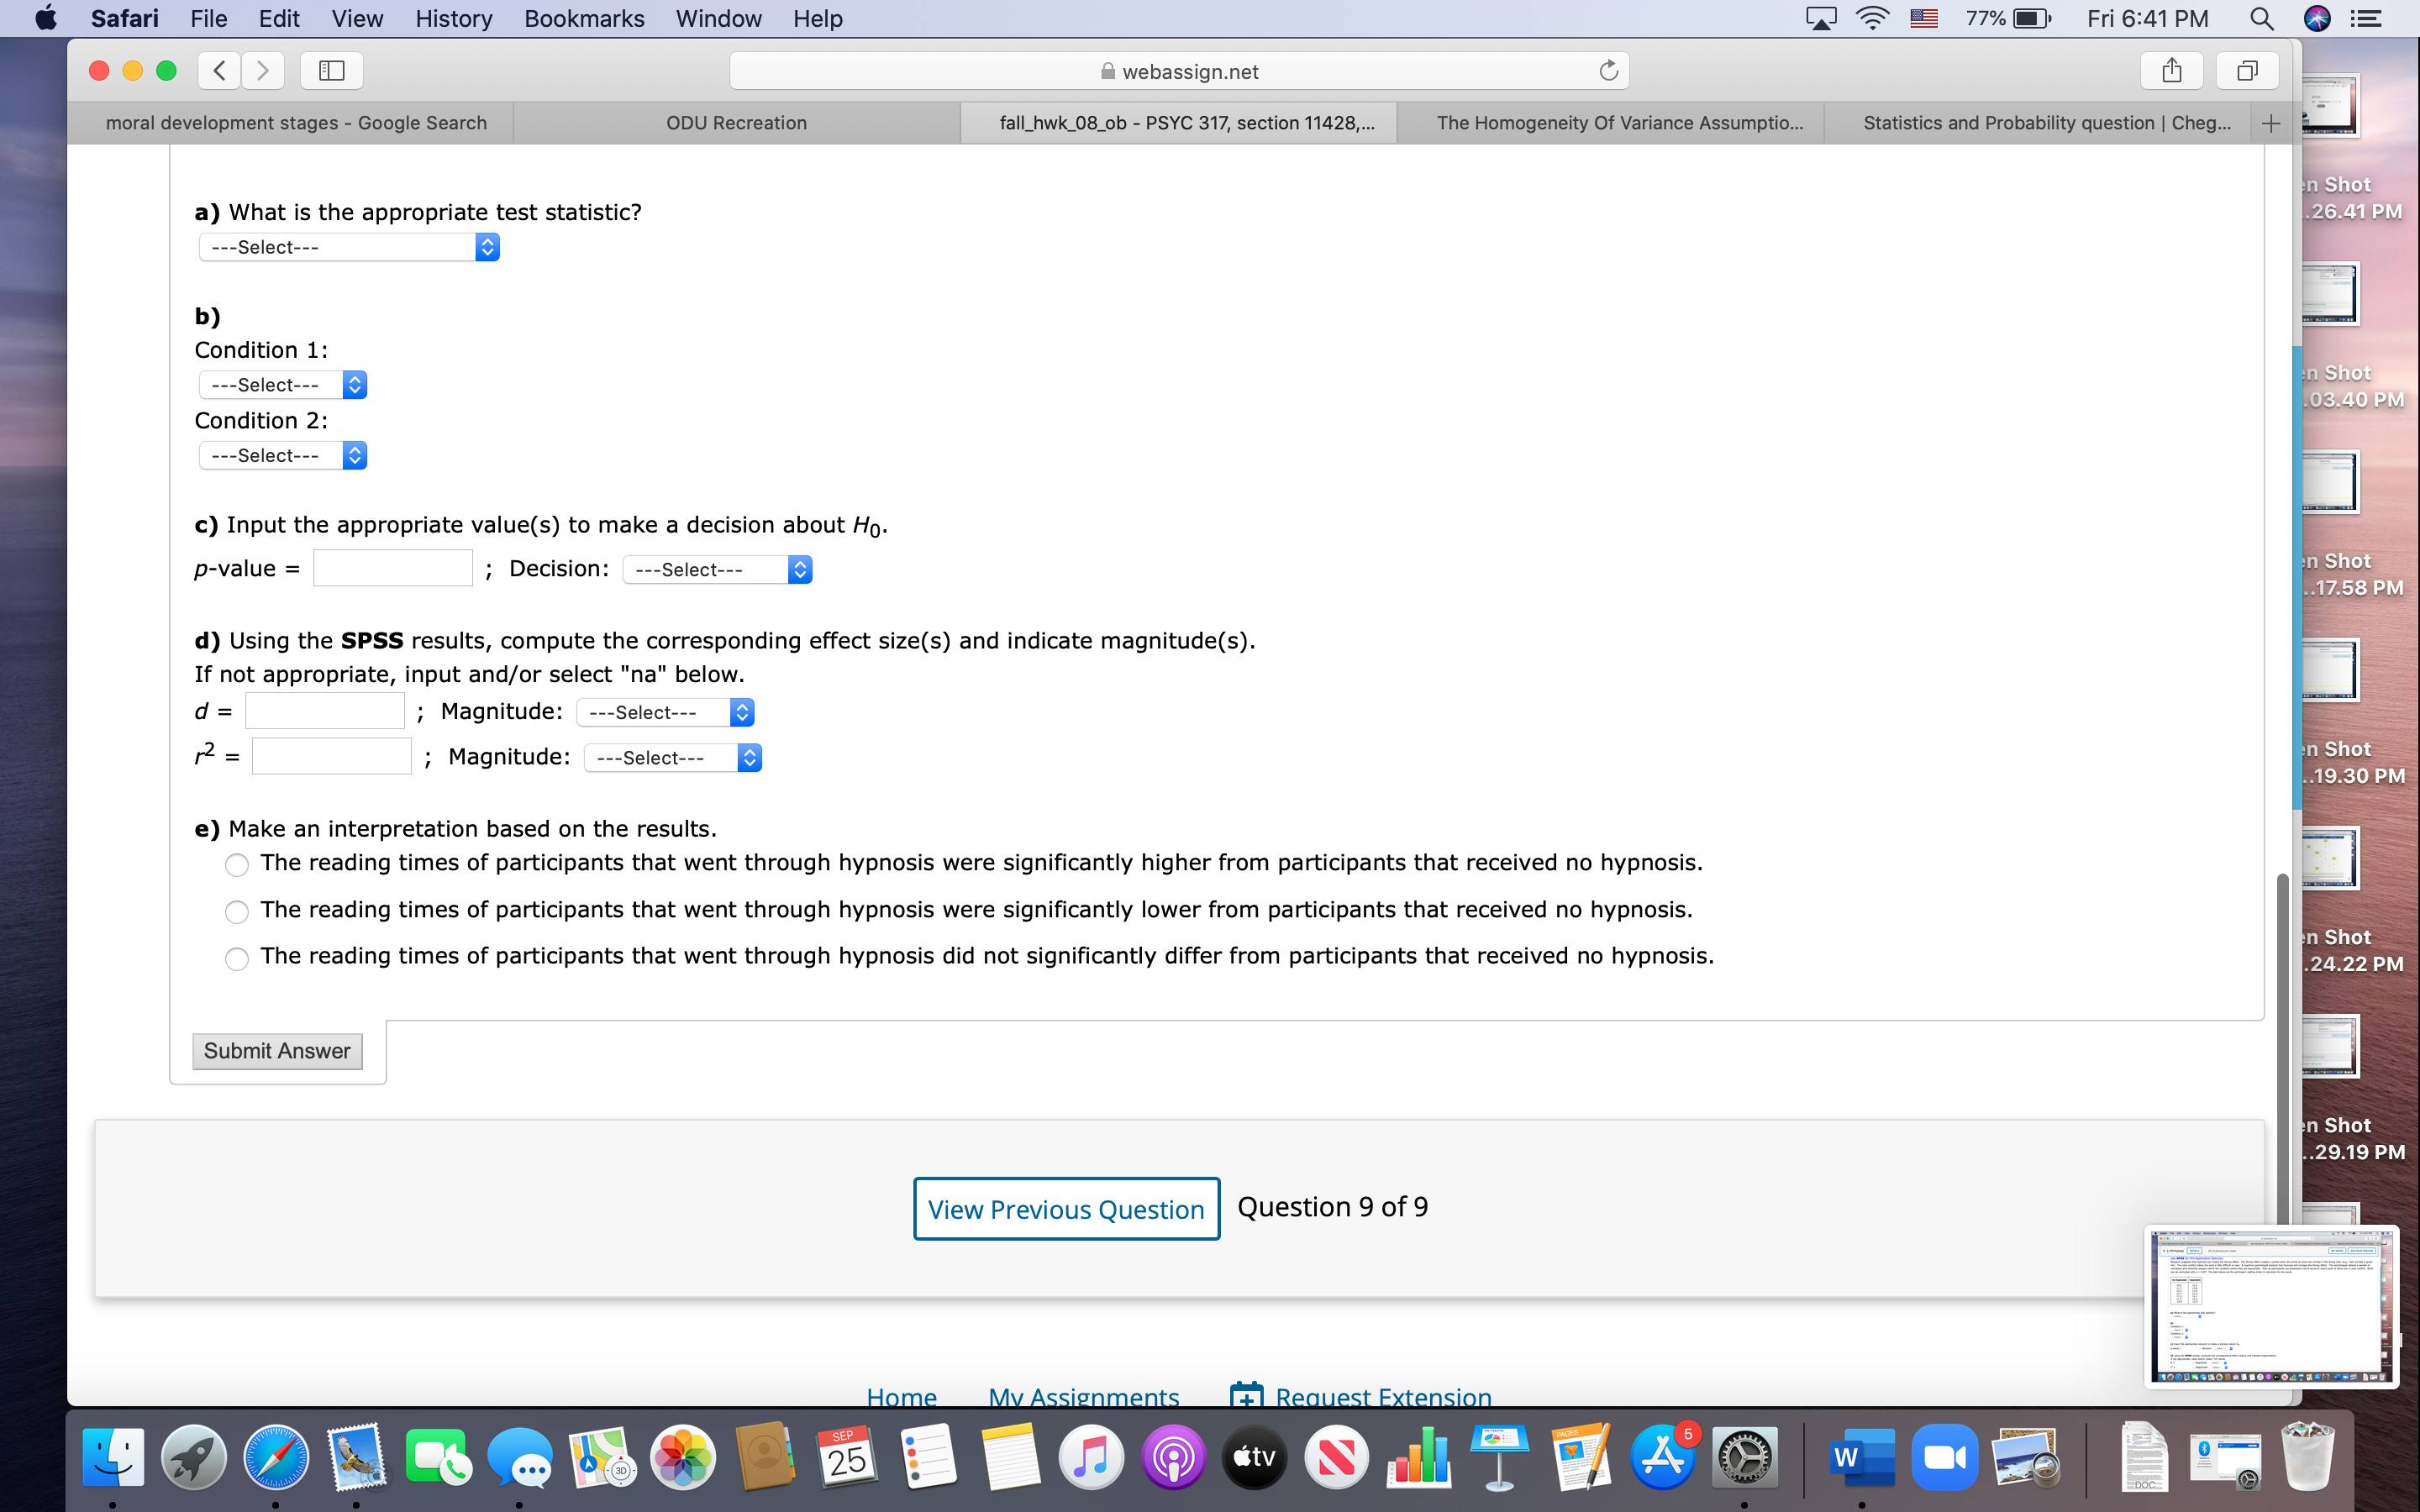

Transcribed Image Text:a) What is the appropriate test statistic?
---Select---
b)
Condition 1:
---Select---
Condition 2:
---Select---
c) Input the appropriate value(s) to make a decision about Ho.
p-value =
; Decision:
---Select---
d) Using the SPSS results, compute the corresponding effect size(s) and indicate magnitude(s).
If not appropriate, input and/or select "na" below.
d =
; Magnitude:
---Select---
; Magnitude:
---Select---
%D
e) Make an interpretation based on the results.
The reading times of participants that went through hypnosis were significantly higher from participants that received no hypnosis.
The reading times of participants that went through hypnosis were significantly lower from participants that received no hypnosis.
The reading times of participants that went through hypnosis did not significantly differ from participants that received no hypnosis.
O O

Expert Solution
This question has been solved!
Explore an expertly crafted, step-by-step solution for a thorough understanding of key concepts.

Step by stepSolved in 2 steps with 1 images

Knowledge Booster


Learn more about
Need a deep-dive on the concept behind this application? Look no further. Learn more about this topic, statistics and related others by exploring similar questions and additional content below.Similar questions
- Consumer Reports stated that the mean time for a Chrysler Concorde to go from 0 to 60 miles per hour is 8.7 seconds. If you want to set up a statistical challenge to claim the average time from 0 to 60 miles per hour is less than 8.7 seconds, what would be the alternate hypothesis and type of test? a)H1: μ< 8.7, right-tailed test b)H1: μ>8.7, two-tailed test c) H1: μ<8.7,left-tailed testarrow_forwardPlease show work on paperarrow_forwardthe value used in the equation for the t-test for independent means that approximates the sample size is known as thearrow_forward
- Assist the statistician to construct a box whisker plot for the data on ``Expenditures per household living in Halifax’’ by computing the following: only the data on Halifax They are not different questions it's part of it!! thank you!arrow_forwardThe average American gets a haircut every 43 days. Is the average larger for college students? The data below shows the results of a survey of 11 college students asking them how many days elapse between haircuts. Assume that the distribution of the population is normal. 38, 37, 38, 45, 53, 55, 35, 37, 35, 41, 38 What can be concluded at the the α = 0.05 level of significance level of significance? For this study, we should use? Select an answer: t-test for a population mean? z-test for a population mean? The null and alternative hypotheses would be: H0:H0? p or μ Select an answer > = ≠ ≤ < ≥ H1:H1? μ or p Select an answer ≠ ≥ > ≤ = < 2. The test statistic ? t z = (please show your answer to 3 decimal places.) The p-value = _______ (Please show your answer to 3 decimal places.) The p-value is? > or ≤ α 3. Based on this, we should?? Select an answer reject ? accept ? or fail to reject ?…arrow_forwardYou may need to use the appropriate appendix table or technology to answer this question. The following results are for independent random samples taken from two populations. Sample 1 Sample 2 n1 = 20 n, = 30 X1 = 22.7 X2 = 20.1 s, = 2.3 2 = 4.6 (a) What is the point estimate of the difference between the two population means? (Use x, - x,.) 2.72 (b) What is the degrees of freedom for the t distribution? (Round your answer down to the nearest integer.) 48 (c) At 95% confidence, what is the margin of error? (Round your answer to one decimal place.) 1.9 (d) What is the 95% confidence interval for the difference between the two population means? (Use x, - Round your answers to one decimal place.) .6 to 4.4arrow_forward
- nd the 30th and 98th percentile values cf a normal variable with Mean of 12_and Variance of 30 Anot This I NEED PARTBI b), Suppose we sample 3 items from this population. Find the variables that correspond to the central 85% Confident Interval range of the sum of these 3 samples.arrow_forwardMeasures average (central tendency/ location). The test scores of a class of students are presented by the following date set: 88, 86, 66, 50, 65, 90, 98, 100, 76, 89, 66, 89, 88, 90, 91, 90, 40, 77, 82, 86 Note: Recall the definitions of measures of central tendency. 10Extra: Subtract 5 points from each score. How would requested measures of average change? Generalize and make a conjecture. Find and compare ranges / midranges of both data sets. Find the mean, median, and mode. Mean, median, modearrow_forwardI need help with this pleasearrow_forward
arrow_back_ios
arrow_forward_ios
Recommended textbooks for you
- MATLAB: An Introduction with ApplicationsStatisticsISBN:9781119256830Author:Amos GilatPublisher:John Wiley & Sons Inc
 Probability and Statistics for Engineering and th...StatisticsISBN:9781305251809Author:Jay L. DevorePublisher:Cengage Learning
 Statistics for The Behavioral Sciences (MindTap C...StatisticsISBN:9781305504912Author:Frederick J Gravetter, Larry B. WallnauPublisher:Cengage Learning
  Elementary Statistics: Picturing the World (7th E...StatisticsISBN:9780134683416Author:Ron Larson, Betsy FarberPublisher:PEARSON
 The Basic Practice of StatisticsStatisticsISBN:9781319042578Author:David S. Moore, William I. Notz, Michael A. FlignerPublisher:W. H. Freeman
 Introduction to the Practice of StatisticsStatisticsISBN:9781319013387Author:David S. Moore, George P. McCabe, Bruce A. CraigPublisher:W. H. Freeman
MATLAB: An Introduction with Applications
Statistics
ISBN:9781119256830
Author:Amos Gilat
Publisher:John Wiley & Sons Inc
Probability and Statistics for Engineering and th...
Statistics
ISBN:9781305251809
Author:Jay L. Devore
Publisher:Cengage Learning
Statistics for The Behavioral Sciences (MindTap C...
Statistics
ISBN:9781305504912
Author:Frederick J Gravetter, Larry B. Wallnau
Publisher:Cengage Learning
Elementary Statistics: Picturing the World (7th E...
Statistics
ISBN:9780134683416
Author:Ron Larson, Betsy Farber
Publisher:PEARSON
The Basic Practice of Statistics
Statistics
ISBN:9781319042578
Author:David S. Moore, William I. Notz, Michael A. Fligner
Publisher:W. H. Freeman
Introduction to the Practice of Statistics
Statistics
ISBN:9781319013387
Author:David S. Moore, George P. McCabe, Bruce A. Craig
Publisher:W. H. Freeman