
MATLAB: An Introduction with Applications
6th Edition
ISBN: 9781119256830
Author: Amos Gilat
Publisher: John Wiley & Sons Inc
expand_more
expand_more
format_list_bulleted
Related questions
Topic Video
Question
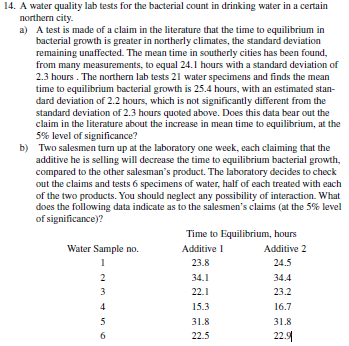

Transcribed Image Text:14. A water quality lab tests for the bacterial count in drinking water in a certain
northern city.
a) A test is made of a claim in the literature that the time to equilibrium in
bacterial growth is greater in northerly climates, the standard deviation
remaining unaffected. The mean time in southerly cities has been found,
from many measurements, to equal 24.1 hours with a standard deviation of
2.3 hours. The northern lab tests 21 water specimens and finds the mean
time to equilibrium bacterial growth is 25.4 hours, with an estimated stan-
dard deviation of 2.2 hours, which is not significantly different from the
standard deviation of 2.3 hours quoted above. Does this data bear out the
claim in the literature about the increase in mean time to equilibrium, at the
5% level of significance?
b) Two salesmen turn up at the laboratory one week, each claiming that the
additive he is selling will decrease the time to equilibrium bacterial growth,
compared to the other salesman's product. The laboratory decides to check
out the claims and tests 6 specimens of water, half of each treated with each
of the two products. You should neglect any possibility of interaction. What
does the following data indicate as to the salesmen's claims (at the 5% level
of significance)?
Time to Equilibrium, hours
Water Sample no.
Additive 1
Additive 2
23.8
24.5
34.1
34.4
3
22.1
23.2
4
15.3
16.7
31.8
31.8
22.
6.
22.5
Expert Solution
This question has been solved!
Explore an expertly crafted, step-by-step solution for a thorough understanding of key concepts.

Step by stepSolved in 3 steps

Knowledge Booster


Learn more about
Need a deep-dive on the concept behind this application? Look no further. Learn more about this topic, statistics and related others by exploring similar questions and additional content below.Similar questions
- A researcher at a large company has collected data on the beginning salary and current salary of 50 randomly selected employees. The correlation between the data sets is r = 0.912. The summary statistics from the data collected are shown bellow: Beginning Salary Ending Salary Mean x¯=56,340 y¯=82,070 Standard deviation Sx = 5,470 Sy = 7,800 Use a complete sentence to describe the strength and direction of the linear relationship between beginning salary and current salary. Find the equation of the least-squares regression line. (Round to two decimal places)arrow_forwardSuppose babies born after a gestation period of 32 to 35 weeks have a mean weight of 2900 grams and a standard deviation of 900 grams while babies born after a gestation period of 40 weeks have a mean weight of 3400 grams and a standard deviation of 535 grams. If a 35-week gestation period baby weighs 3200 grams and a 40-week gestation period baby weighs 3700 grams, find the corresponding z-scores. Which baby weighs more relative to the gestation period? Find the corresponding z-scores. Which baby weighs relatively more? Select the correct choice below and fill in the answer boxes to complete your choice. (Round to two decimal places as needed.) A. The baby born in week 40 weighs relatively more since its z-score, baby born in week 35. B. The baby born in week 35 weighs relatively more since its z-score, baby born in week 40. C. The baby born in week 40 weighs relatively more since its z-score, baby born in week 35. D. The baby born in week 35 weighs relatively more since its z-score,…arrow_forwardSuppose babies born after a gestation period of 32 to 35 weeks have a mean weight of 2600 grams and a standard deviation of 600 grams while babies born after a gestation period of 40 weeks have a mean weight of 2800 grams and a standard deviation of 390 grams. If a 32-week gestation period baby weighs 2150 grams and a 40-week gestation period baby weighs 2350 grams, find the corresponding z-scores. Which baby weighs less relative to the gestation period?arrow_forward
- Records indicate that the mean weight of mature rainbow trout in Eagle Creek is 1.75 kg with a standard deviation of 0.33 kg. After years of marked oxygen depletion from pollutants in the creek, a biologist wants to see if the standard deviation, o, of weights has changed. The biologist measures the weights of 20 randomly chosen mature rainbow trout from the creek and finds that the sample standard deviation is 0.38 kg. Assume the current weights of mature rainbow trout in the creek follow a normal distribution. Does the biologist have sufficient evidence to conclude that the population standard deviation, o, differs from 0.33 kg? To answer, complete the parts below to perform a hypothesis test. Use the 0.10 level of significance.arrow_forwardSuppose babies born after a gestation period of 32 to 35 weeks have a mean weight of 2700 grams and a standard deviation of 600 grams while babies born after a gestation period of 40 weeks have a mean weight of 3200 grams and a standard deviation of 425 grams. If a 35-week gestation period baby weighs 2850 grams and a 41-week gestation period baby weighs 3350 grams, find the corresponding z-scores. Which baby weighs more relative to the gestation period?arrow_forwardO C. The baby born in week 41 weighs relatively less since its z-score, is larger than the z-score of for the baby born in week 32. O D. The baby born in week 32 weighs relatively less since its z-score, is smaller than the z-score of for the baby born in week 41.arrow_forward
- Gn. don't provide handwriting solutionarrow_forwardSuppose babies born after a gestation period of 32 to 35 weeks have a mean weight of 2600 grams and a standard deviation of 600 grams while babies born after a gestation period of 40 weeks have a mean weight of 2900 grams and a standard deviation of 440 grams. If a 35-week gestation period baby weighs 2775 grams and a 40-week gestation period baby weighs 3075 grams, find the corresponding z-scores. Which baby weighs more relative to the gestation period? Find the corresponding z-scores. Which baby weighs relatively more? Select the correct choice below and fill in the answer boxes to complete your choice. (Round to two decimal places as needed.) A. The baby born in week 40 weighs relatively more since its z-score, is smaller than the z-score of for the baby born in week 35. B. The baby born in week 40 weighs relatively more since its z-score, is larger than the z-score of for the baby born in week 35. O C. The baby born in week 35 weighs relatively more since its z-score, is larger…arrow_forwardDenny studied factors affecting cardiovascular reactivity to a postural change in a sample of healthy men and women. Change in systolic blood pressure (SBP) from supine to standing position was used as the measure of cardiac reactivity in a sample of 842 adults. Supine measurement of blood pressure was taken after participants had lain on an examination table for 15 minutes. Blood pressure was determined every 30 seconds using a Dinamap device for 2 minutes, and the measurements were averaged. Participants then stood up immediately, and additional measurements were made for another 2 minutes. Below is a table describing the characteristics of Denny’s sample: Which measures of dispersion, if any, are presented in this table (Ranges, SDs)? If age is normally distributed, approximately what percent of the sample would be younger than 50? If BMI is normally distributed, approximately what percent of the sample would have a BMI higher than 33.1?arrow_forward
arrow_back_ios
arrow_forward_ios
Recommended textbooks for you
- MATLAB: An Introduction with ApplicationsStatisticsISBN:9781119256830Author:Amos GilatPublisher:John Wiley & Sons Inc
 Probability and Statistics for Engineering and th...StatisticsISBN:9781305251809Author:Jay L. DevorePublisher:Cengage Learning
 Statistics for The Behavioral Sciences (MindTap C...StatisticsISBN:9781305504912Author:Frederick J Gravetter, Larry B. WallnauPublisher:Cengage Learning
  Elementary Statistics: Picturing the World (7th E...StatisticsISBN:9780134683416Author:Ron Larson, Betsy FarberPublisher:PEARSON
 The Basic Practice of StatisticsStatisticsISBN:9781319042578Author:David S. Moore, William I. Notz, Michael A. FlignerPublisher:W. H. Freeman
 Introduction to the Practice of StatisticsStatisticsISBN:9781319013387Author:David S. Moore, George P. McCabe, Bruce A. CraigPublisher:W. H. Freeman
MATLAB: An Introduction with Applications
Statistics
ISBN:9781119256830
Author:Amos Gilat
Publisher:John Wiley & Sons Inc
Probability and Statistics for Engineering and th...
Statistics
ISBN:9781305251809
Author:Jay L. Devore
Publisher:Cengage Learning
Statistics for The Behavioral Sciences (MindTap C...
Statistics
ISBN:9781305504912
Author:Frederick J Gravetter, Larry B. Wallnau
Publisher:Cengage Learning
Elementary Statistics: Picturing the World (7th E...
Statistics
ISBN:9780134683416
Author:Ron Larson, Betsy Farber
Publisher:PEARSON
The Basic Practice of Statistics
Statistics
ISBN:9781319042578
Author:David S. Moore, William I. Notz, Michael A. Fligner
Publisher:W. H. Freeman
Introduction to the Practice of Statistics
Statistics
ISBN:9781319013387
Author:David S. Moore, George P. McCabe, Bruce A. Craig
Publisher:W. H. Freeman